Arc Index
What Is the Bold Arc Human Progress Index?
Ed Kopko
·
June 2026
·
10 min read
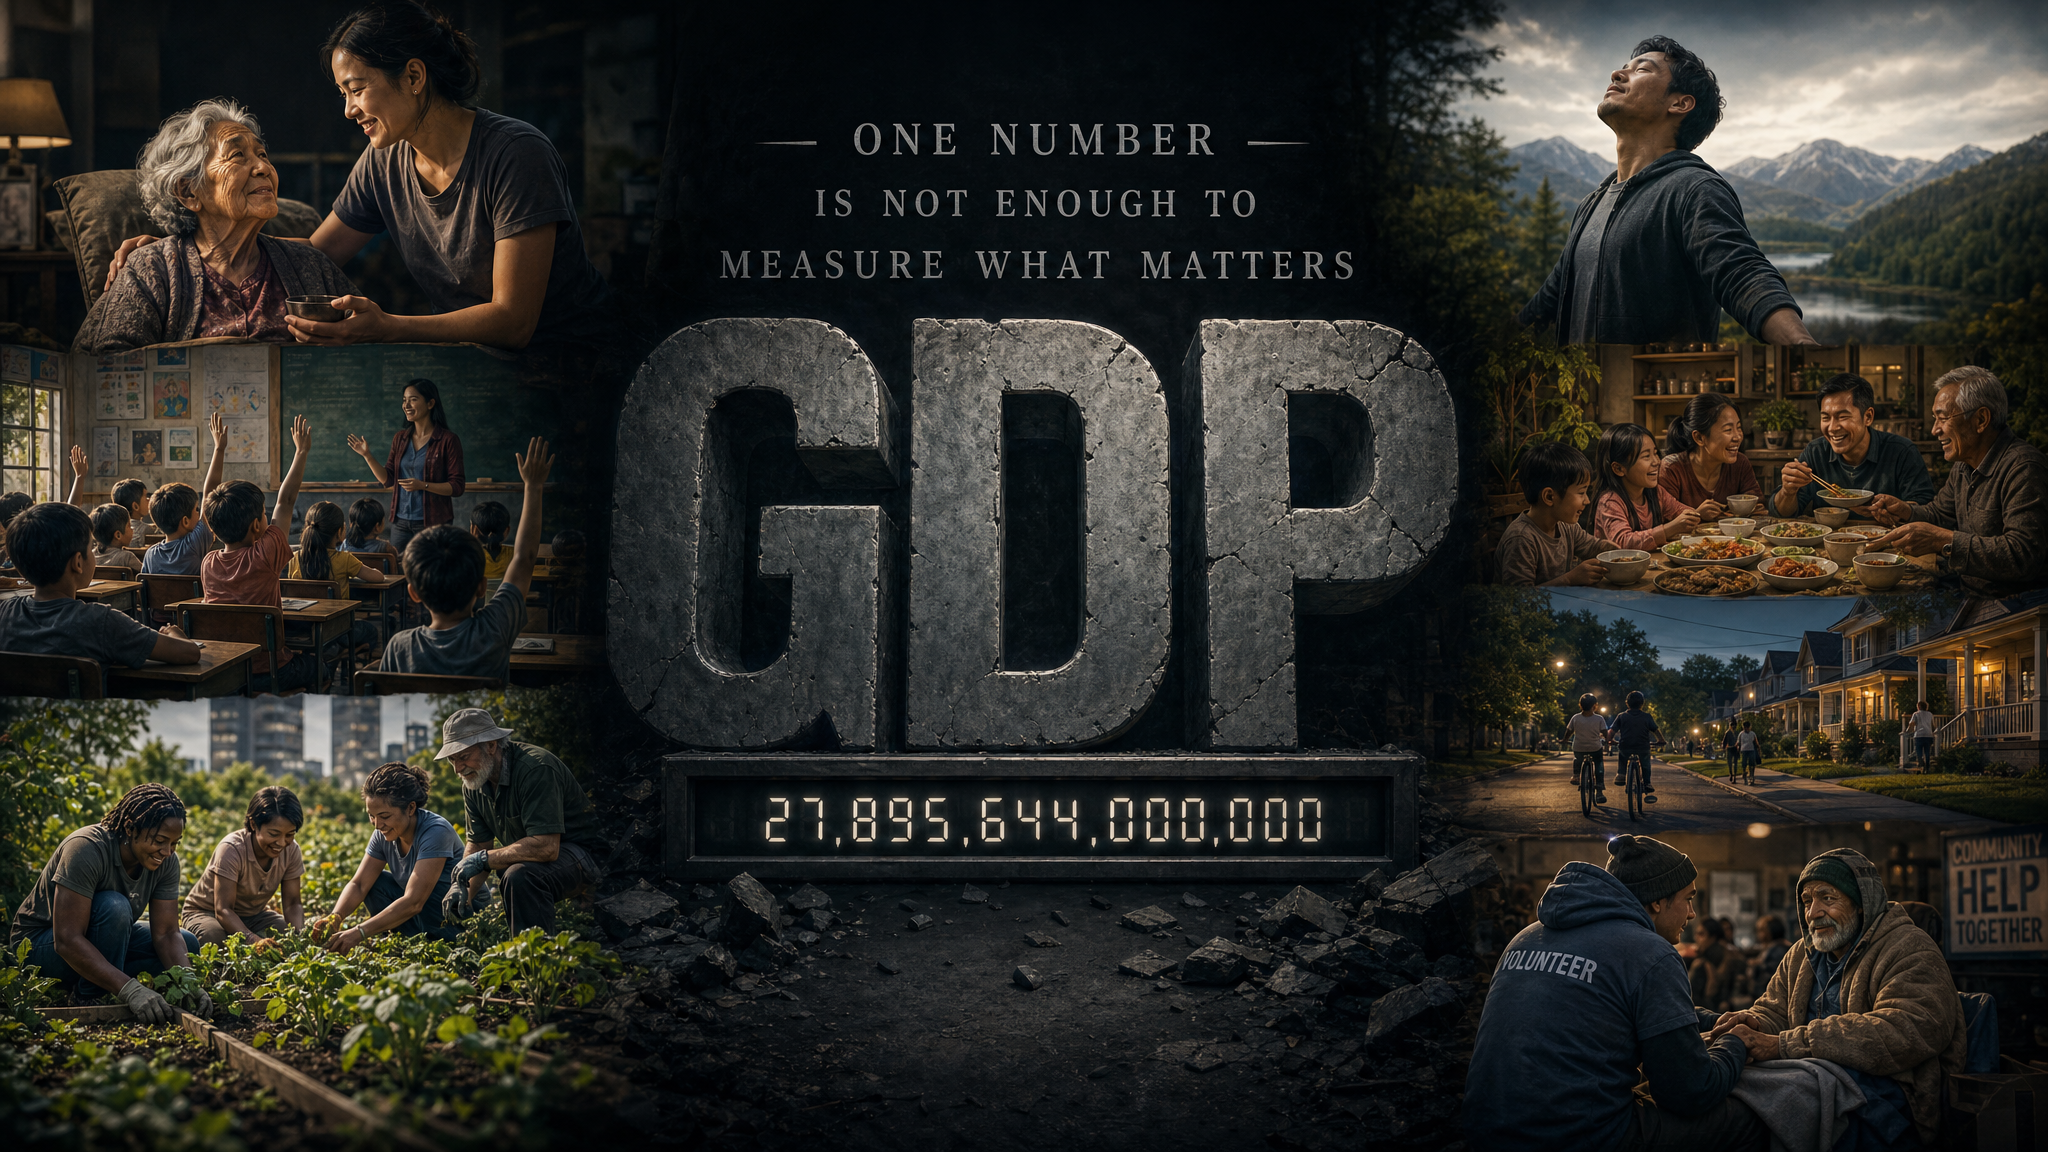
The Bold Arc Human Progress Index is the first composite measure of human progress across nine dimensions of human need — scoring every US state and country on the things people actually pursue, not just the economic output they generate doing it.
It produces two numbers for every state and country: an Arc Level — where it stands today — and an Arc Momentum — whether the arc is bending upward or downward, and how fast. Together, they tell a more complete story than any single metric can.
The index does not replace economic data. GDP remains one of the most useful instruments ever built for what it was designed to measure. The Arc Index adds the nine dimensions of human wellbeing that GDP was never designed to capture — and that policy, investment, and human choice ultimately depend on.
"GDP measures how fast the economic engine is running. The Arc Index measures whether the passengers are actually doing well."
The Nine Dimensions
In 1943, Abraham Maslow mapped the hierarchy of needs that drives all human motivation. The nine dimensions of the Arc Index correspond directly to that hierarchy — from physiological survival at the base to self-actualization at the apex. They are weighted by their fundamental importance to human flourishing, with the most basic needs carrying the highest weight.
Dimension 01
❤️
Health & Longevity
18% — Highest weighted
Life expectancy, infant mortality, and healthy life years. The most fundamental dimension — and the one with the longest documented data history. A state or country failing here is failing at everything.
Dimension 02
🛡️
Safety & Security
15%
Freedom from crime, violence, and economic instability. Maslow's second tier — the platform every other dimension rests on. You cannot pursue education when you are afraid.
Dimension 03
📚
Education & Knowledge
14%
Access to learning, information, and the skills that expand human capability. Includes internet connectivity — in 2025, information access is education access.
Dimension 04
🌾
Nutrition & Food Security
12%
Whether people have enough food — and food that keeps them healthy. In developed economies the crisis has shifted from scarcity to quality; globally, 700M remain food insecure.
Dimension 05
🏠
Housing & Shelter
12%
Whether people can afford a safe, stable home. The dimension where the United States has shown the most significant regression of any wealthy nation over the past decade.
Dimension 06
🤝
Happiness & Connection
12%
Life satisfaction, social bonds, mental health, community trust. The dimension where the US most dramatically underperforms relative to its wealth — ranking 23rd globally despite #5 GDP.
Dimension 07
⚡
Energy & Comfort
7%
Access to reliable, affordable energy. The single brightest dividing line between developed and developing worlds on the global index — 750 million people still lack electricity.
Dimension 08
🗽
Freedom & Agency
7%
Economic freedom, political freedom, personal autonomy — the ability to make meaningful choices about one's own life. Measured by internationally recognized, politically neutral indices.
Dimension 09
✨
Transcendence & Purpose
3%
Whether people feel their lives have meaning beyond survival. The apex of Maslow's hierarchy. Measured through purpose scores, volunteering rates, and civic engagement — the dimension that predicts long-term wellbeing better than income above a threshold.
100
Points on the Arc Level scale
Each dimension scores 0 to 100. The nine scores are weighted and combined into the Arc Level composite. No state or country scores 100 — the ceiling represents an aspirational standard, not an achievable ceiling. Every point gained is real, measurable human progress.
Two Numbers: Arc Level and Arc Momentum
Every state and country in the index receives two scores. Both are necessary. Neither alone tells the full story.
Score One
72/100
Arc Level
Where a state or country stands today across all nine dimensions. A snapshot of current human progress. Comparable across all 50 states and all countries in the index.
Score Two
+3.2
Arc Momentum
The direction and pace of change. Is the arc bending upward or downward — and how fast? A state ranked 40th with +4.7 momentum is a more optimistic story than one ranked 12th with -1.8.
How to Read a State's Arc Score
Arc Level 74, Momentum +2.4 — Strong performer, still climbing. Most dimensions are solid; the arc is bending upward. Watch for the dimension pulling it down — that is where the opportunity lives.
Arc Level 55, Momentum +5.1 — Below the median but ascending faster than almost anyone. If momentum holds, this state will look very different in five years. The story is the trajectory, not the current rank.
Arc Level 79, Momentum -1.6 — Near the top but quietly losing ground. The headline rank flatters; the trend worries. Something is eroding — housing costs, social trust, health outcomes — that will matter more than the current rank in a decade.
Arc Level 38, Momentum -0.9 — Bottom of the index and falling. Multiple dimensions declining simultaneously. The most urgent story the index tells — and where the most actionable policy conversation needs to happen.
The Data Behind the Scores
Every dimension score is built from publicly available, independently verifiable data. The Arc Index does not generate its own surveys or proprietary numbers. It is a composite of the best existing data sources — applied consistently, weighted by importance, and updated annually.
Primary Data Sources by Dimension
Health & Longevity: CDC National Center for Health Statistics, WHO Global Health Observatory, IHME Global Burden of Disease
Safety & Security: FBI Uniform Crime Reports, Bureau of Labor Statistics, EPA Air Quality Index, NHTSA
Education & Knowledge: National Center for Education Statistics, US Census Bureau, UNESCO, FCC Broadband Data
Nutrition & Food Security: USDA Economic Research Service, CDC NHANES, BLS Consumer Expenditure Survey
Housing & Shelter: Census Bureau American Community Survey, HUD, National Association of Realtors
Happiness & Connection: Gallup World Poll (Cantril Ladder), General Social Survey, CDC mental health surveys
Energy, Freedom & Purpose: EIA, Heritage Foundation Economic Freedom Index, Freedom House, Pew Research, Gallup purpose scores
What's Coming — The September Release and Beyond
The first edition of the Bold Arc Human Progress Index publishes in September 2026 — covering 2025 data for all 50 US states and countries worldwide. After that, the index updates annually each September, with a mid-year Arc Momentum Report every March tracking leading indicators between full releases.
July 2026
Dimension Series Begins
One article per dimension, July through August — introducing each of the nine measures with current data, state leaders and laggards, and global comparisons.
September 2026
US States Index — Full Release
All 50 states ranked across all nine dimensions. Arc Level + Arc Momentum for every state. The biggest movers, the surprises, and the full dimension breakdown.
September 2026
World Index — Full Release
Countries worldwide ranked on the Maslow Economic Ascent. Where each nation sits on the hierarchy — and what the data predicts about where it goes next.
October 2026
Cross-Comparisons Launch
The Arc Index's most original format: France vs. Florida. California vs. India. Texas vs. Germany. State-to-country comparisons that reveal what GDP never could.
March 2027
First Arc Momentum Report
Mid-year directional signal: which dimensions are trending better or worse than the September baseline, using faster-moving indicators.
September 2027
Year 2 Full Release
The first year-over-year comparison. Which states climbed, which fell, and what drove the change. The moment the Arc Index becomes a longitudinal data franchise.
The Bold Arc Human Progress Index
The full 2025 data releases September 2026.
Be the first to see your state's score.
Subscribe to The Bold Wire and we'll send you your state's complete Arc Level, Arc Momentum, and dimension-by-dimension breakdown the moment it publishes. Plus the full dimension series through the summer — one article per week, July through August.