
The Arc of Ascent
Nine dimensions of human progress · From survival to self-actualization
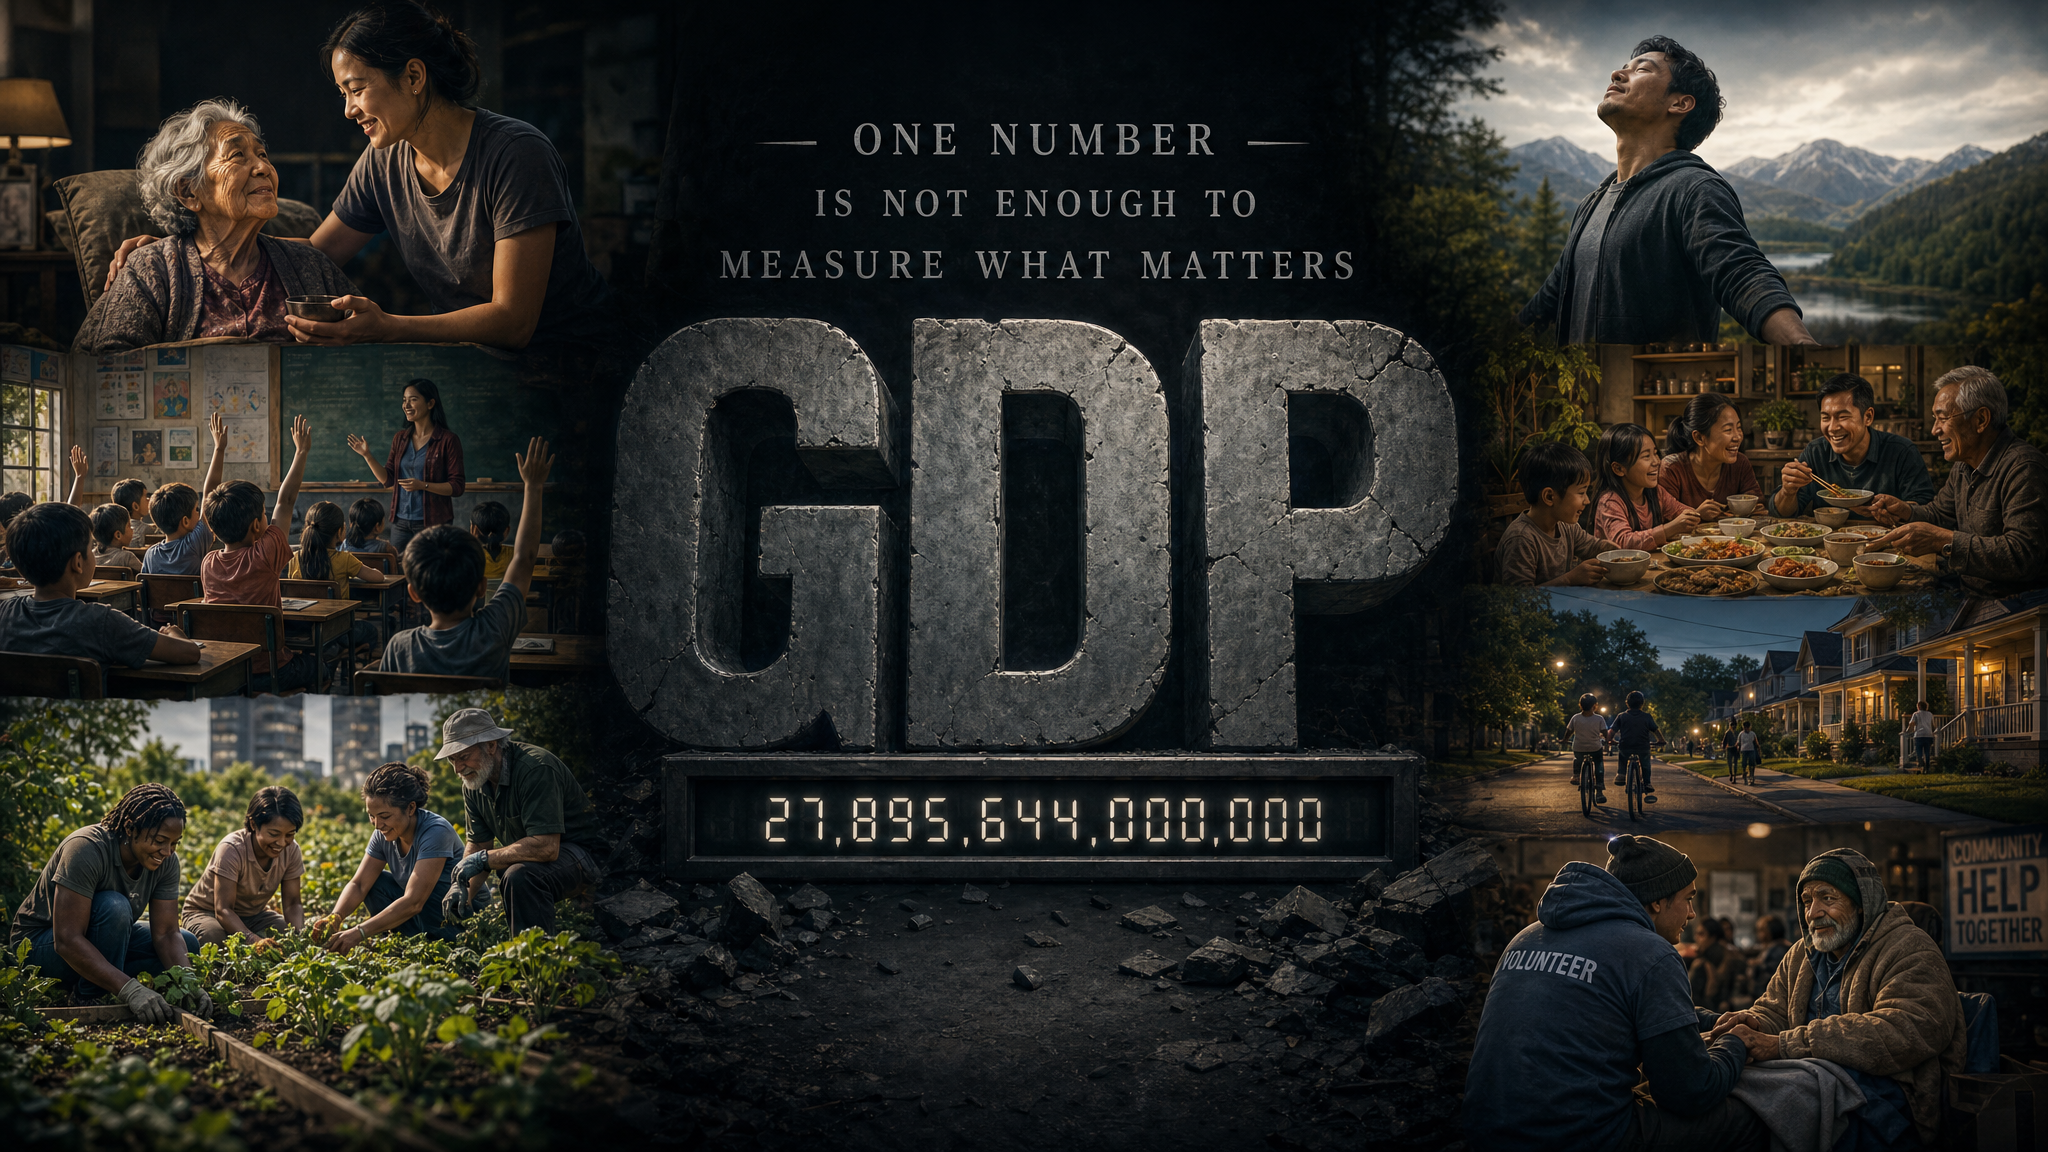
GDP tells you how fast the economic engine is running. It was never designed to tell you whether the passengers are doing well. The Bold Arc Human Progress Index measures what matters: nine dimensions of human flourishing, scored and ranked for every U.S. state and 50+ nations — arriving September 2026.
The full Arc Index — 50 U.S. states + 50 nations ranked across all nine dimensions — publishes September 2026. Subscribe to be first.
Two foundational reads. Start here to understand what the Arc Index is, why it was built, and why the alternative — GDP — is not enough.
 Foundation · Part 1
GDP measures how fast the economic engine is running. It was never designed to tell you whether the passengers are doing well. The case for a better yardstick — and what nine dimensions reveal that one number cannot.
Read the manifesto →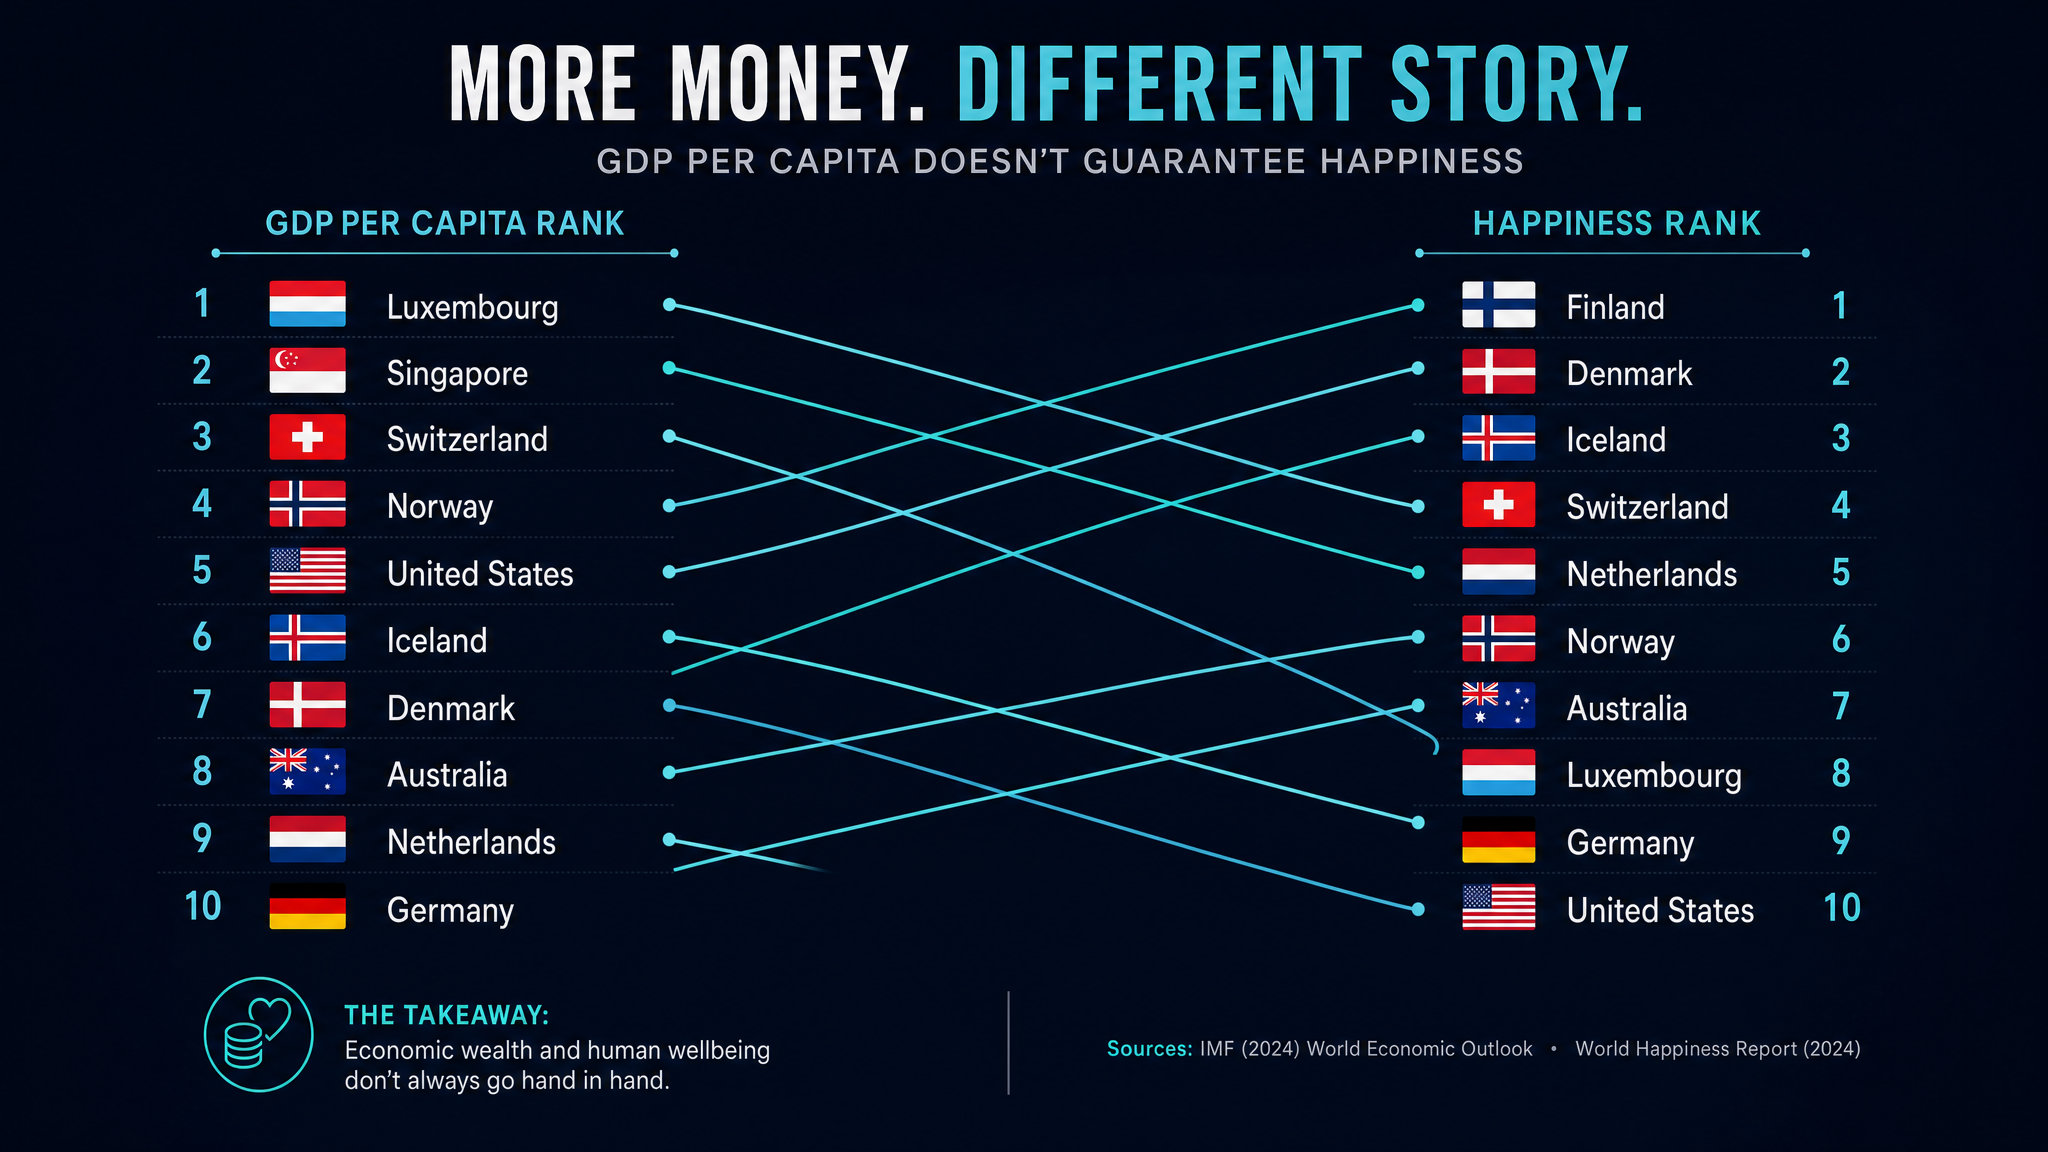 Foundation · Part 2
How do you turn nine dimensions of human flourishing into a single defensible score? A behind-the-scenes look at the data sources, weighting logic, and design decisions that power the Arc Index.
Read the methodology →Dimension deep dives, country spotlights, state analyses, and cross-comparisons — published as they land. This feed grows throughout 2026.
The number that runs the world was designed in 1934. It counts war spending and oil spills as growth. It misses life expectancy, housing costs, and happiness entirely. This is why that has to change.
Read the manifesto →
Health & Longevity deep dive — life expectancy, infant mortality, healthy years across 50 states and 50 nations.
Coming July 2026The first full country-level Arc Score breakdown — with a head-to-head comparison that will surprise you.
Coming August 2026Nine deep dives. Each article unpacks one dimension — what it measures, why the weighting is justified, the global data, and what the U.S. gets right, wrong, and badly wrong. Publishing through fall 2026.
Three flagship data releases. Every state, every major nation, and the cross-comparisons that reveal what the aggregate scores hide.
Every U.S. state scored and ranked across all nine dimensions. Which states win on safety but lose on housing? Which ones lead in health but trail in happiness? The full picture — with the uncomfortable surprises.
50+ nations ranked by Arc Level. GDP per capita predicts the Arc Score — but only partially. The nations that outperform their wealth, and the wealthy nations that are quietly failing their citizens, are the real story.
U.S. states vs. nations. Coastal vs. heartland. Peers vs. peers. The cross-comparisons collapse the artificial borders between state and country data to reveal patterns that neither dataset shows alone.
Is Mississippi closer to Mexico or Massachusetts on the Arc Index? How does California's housing dimension compare to Germany's? Which Nordic nation most closely matches the top-ranked U.S. state? When we strip the labels and compare the scores — the answers are uncomfortable, instructive, and sometimes inspiring.