In 1934, an economist named Simon Kuznets delivered a report to the United States Congress. It was a technical document — a new system for measuring national income that would help the government understand the size and output of the American economy during the Great Depression. Kuznets had built something genuinely useful: a method to count the total value of goods and services a nation produces. We now call it Gross Domestic Product.
In that same report, Kuznets included a warning. It was direct and unambiguous. He wrote that "the welfare of a nation can scarcely be inferred from a measurement of national income."
The warning was ignored. GDP became the world's dominant measure of national success — applied to questions about quality of life, human flourishing, and societal progress that it was never designed to answer. Ninety years later, almost every major policy decision in almost every country is still anchored to a number whose inventor specifically said it couldn't do the job we're asking of it.
GDP is not wrong. It measures what it measures with precision and consistency. The problem is that what it measures is not the same thing as how well people are actually living.
That gap is what the Bold Arc Human Progress Index was built to close.
What GDP Was Built to Do — and Why It Did It Well
GDP was not invented by academics. It was invented by policymakers who needed to answer a specific, urgent question: how large is our economy, and is it growing?
In 1933, the United States had no reliable way to measure its own economic output. Congress was debating the New Deal without a consistent measure of what the economy was actually doing. Kuznets was commissioned to build one. He did — and the tool he built was, for its intended purpose, a genuine breakthrough.
GDP counts all economic activity: goods produced, services rendered, investments made, government spending executed. It is consistent, comparable across countries and time periods, and highly responsive to change. When economies grow, GDP grows. When they contract, GDP contracts. As a measure of economic activity, it remains the best instrument ever built for that specific job.
The problem began when the question changed. After World War II, GDP became not just a measure of economic output but a proxy for national wellbeing — a shortcut for "how are we doing?" The reasoning seemed intuitive: richer countries had better hospitals, better roads, more food. Economic growth correlated with many things people valued. So GDP became the target, and making it grow became the goal.
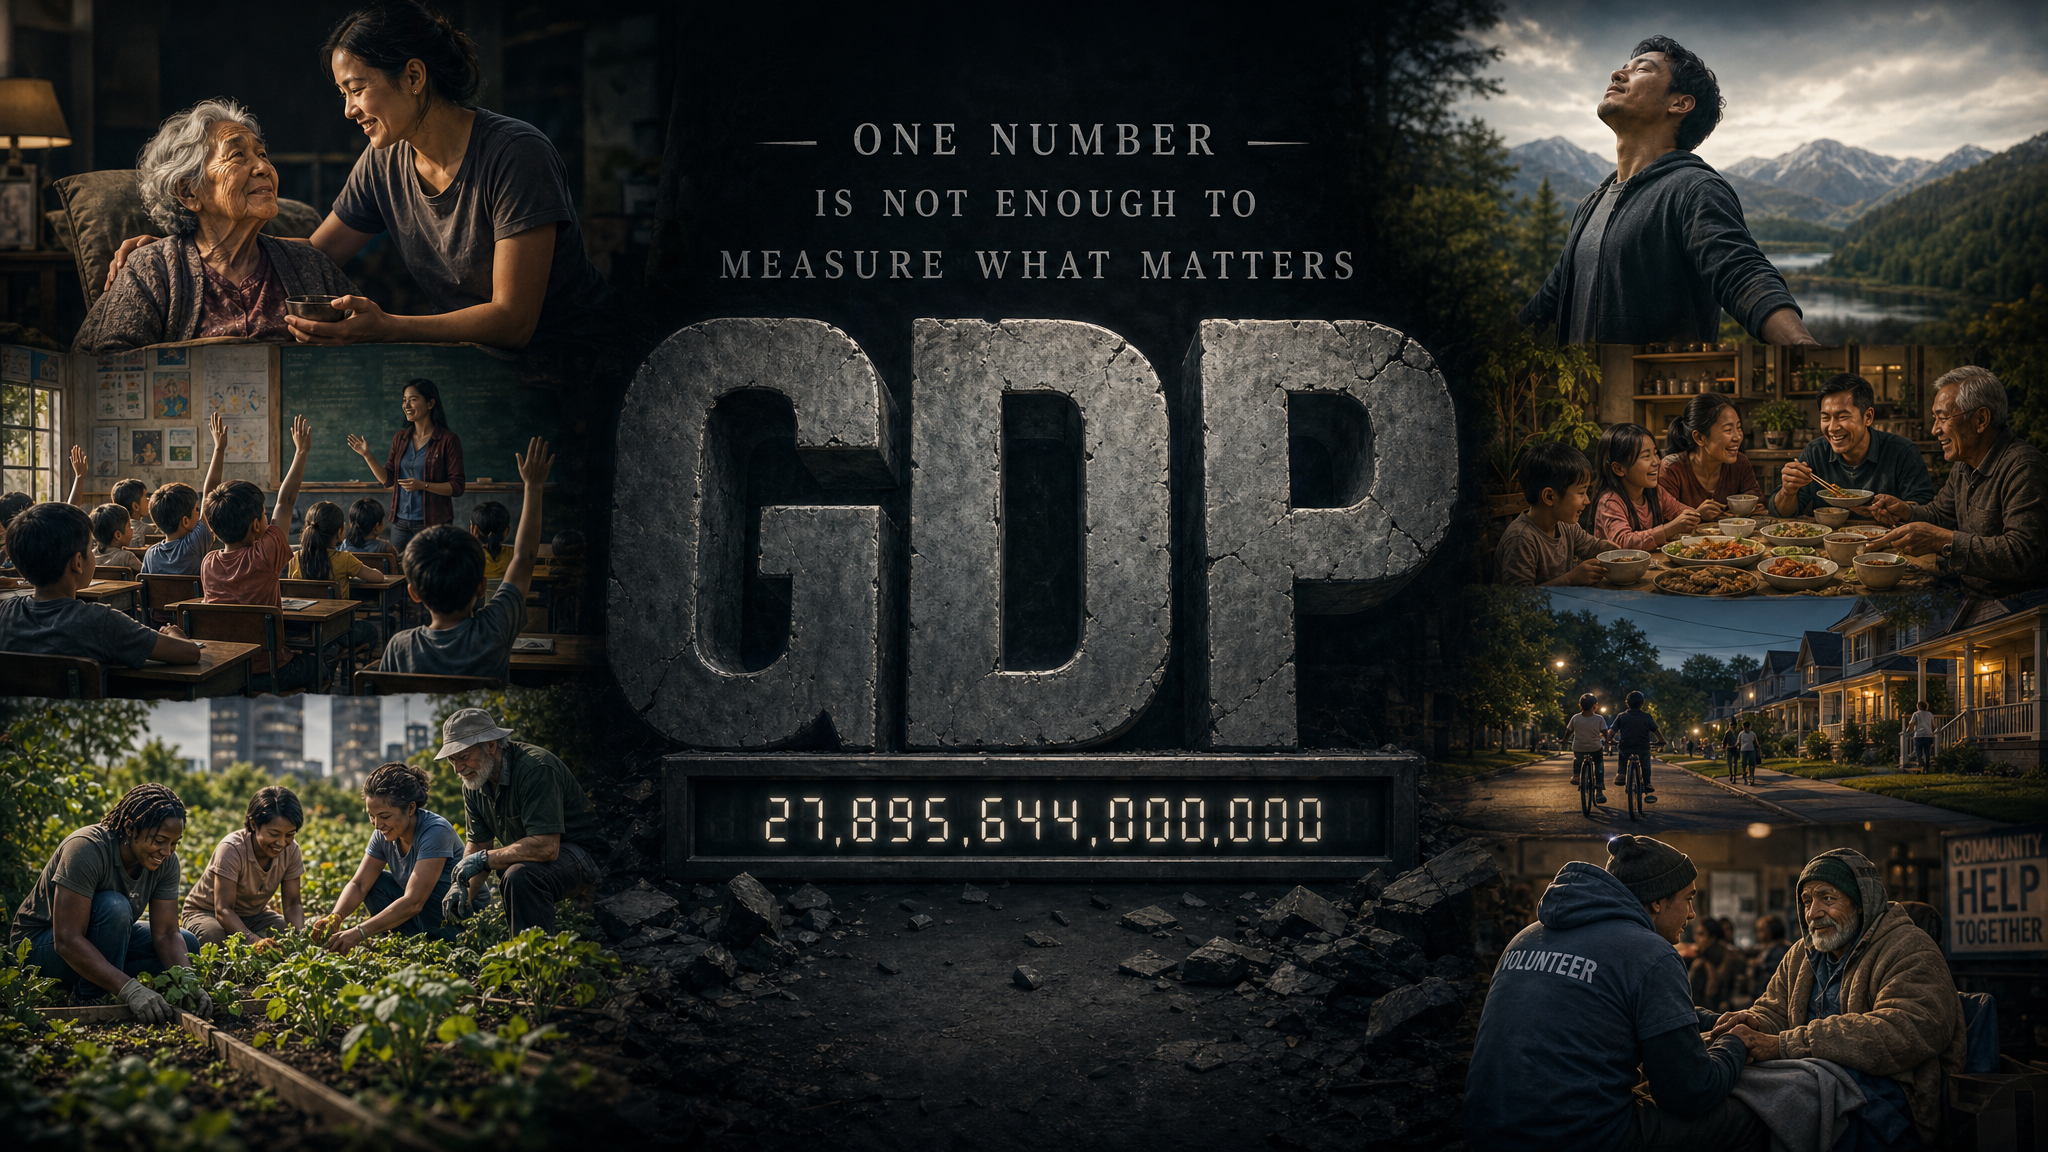
That conflation produced a measurement system with a fundamental flaw: it counts some things that don't improve lives, and misses entirely many things that do.
- A car accident — hospital bills, vehicle repairs, legal fees, towing, physical therapy all add to GDP
- An oil spill — cleanup operations, legal settlements, environmental consulting
- A prison sentence — incarceration costs, legal system activity, construction of new facilities
- A chronic illness — ongoing pharmaceutical spending, repeated hospitalizations, long-term care costs
- Advertising — whether it creates value or just shifts market share between competitors
- Financial speculation — trading volume, regardless of whether any real-world value was created
- A parent reading to a child every night — no transaction, no GDP contribution
- A neighborhood where crime fell 40% in five years — safety has no price tag
- A volunteer who spends 10 hours a week feeding the homeless
- Clean air that prevents 10,000 hospitalizations — the absence of illness creates no revenue
- A generation with higher life expectancy than their parents
- Social trust — the degree to which people feel safe, connected, and supported by their community
- Meaningful work — GDP counts hours logged, not whether the work felt purposeful
This is not an argument against GDP. It is an argument for GDP plus. The economy matters enormously — economic growth has lifted more people out of poverty than any other force in human history. But economic output is an input to human wellbeing, not the same thing as human wellbeing. The two track each other at low income levels and diverge dramatically at high ones.
The Divergence — Where GDP and Human Progress Part Ways
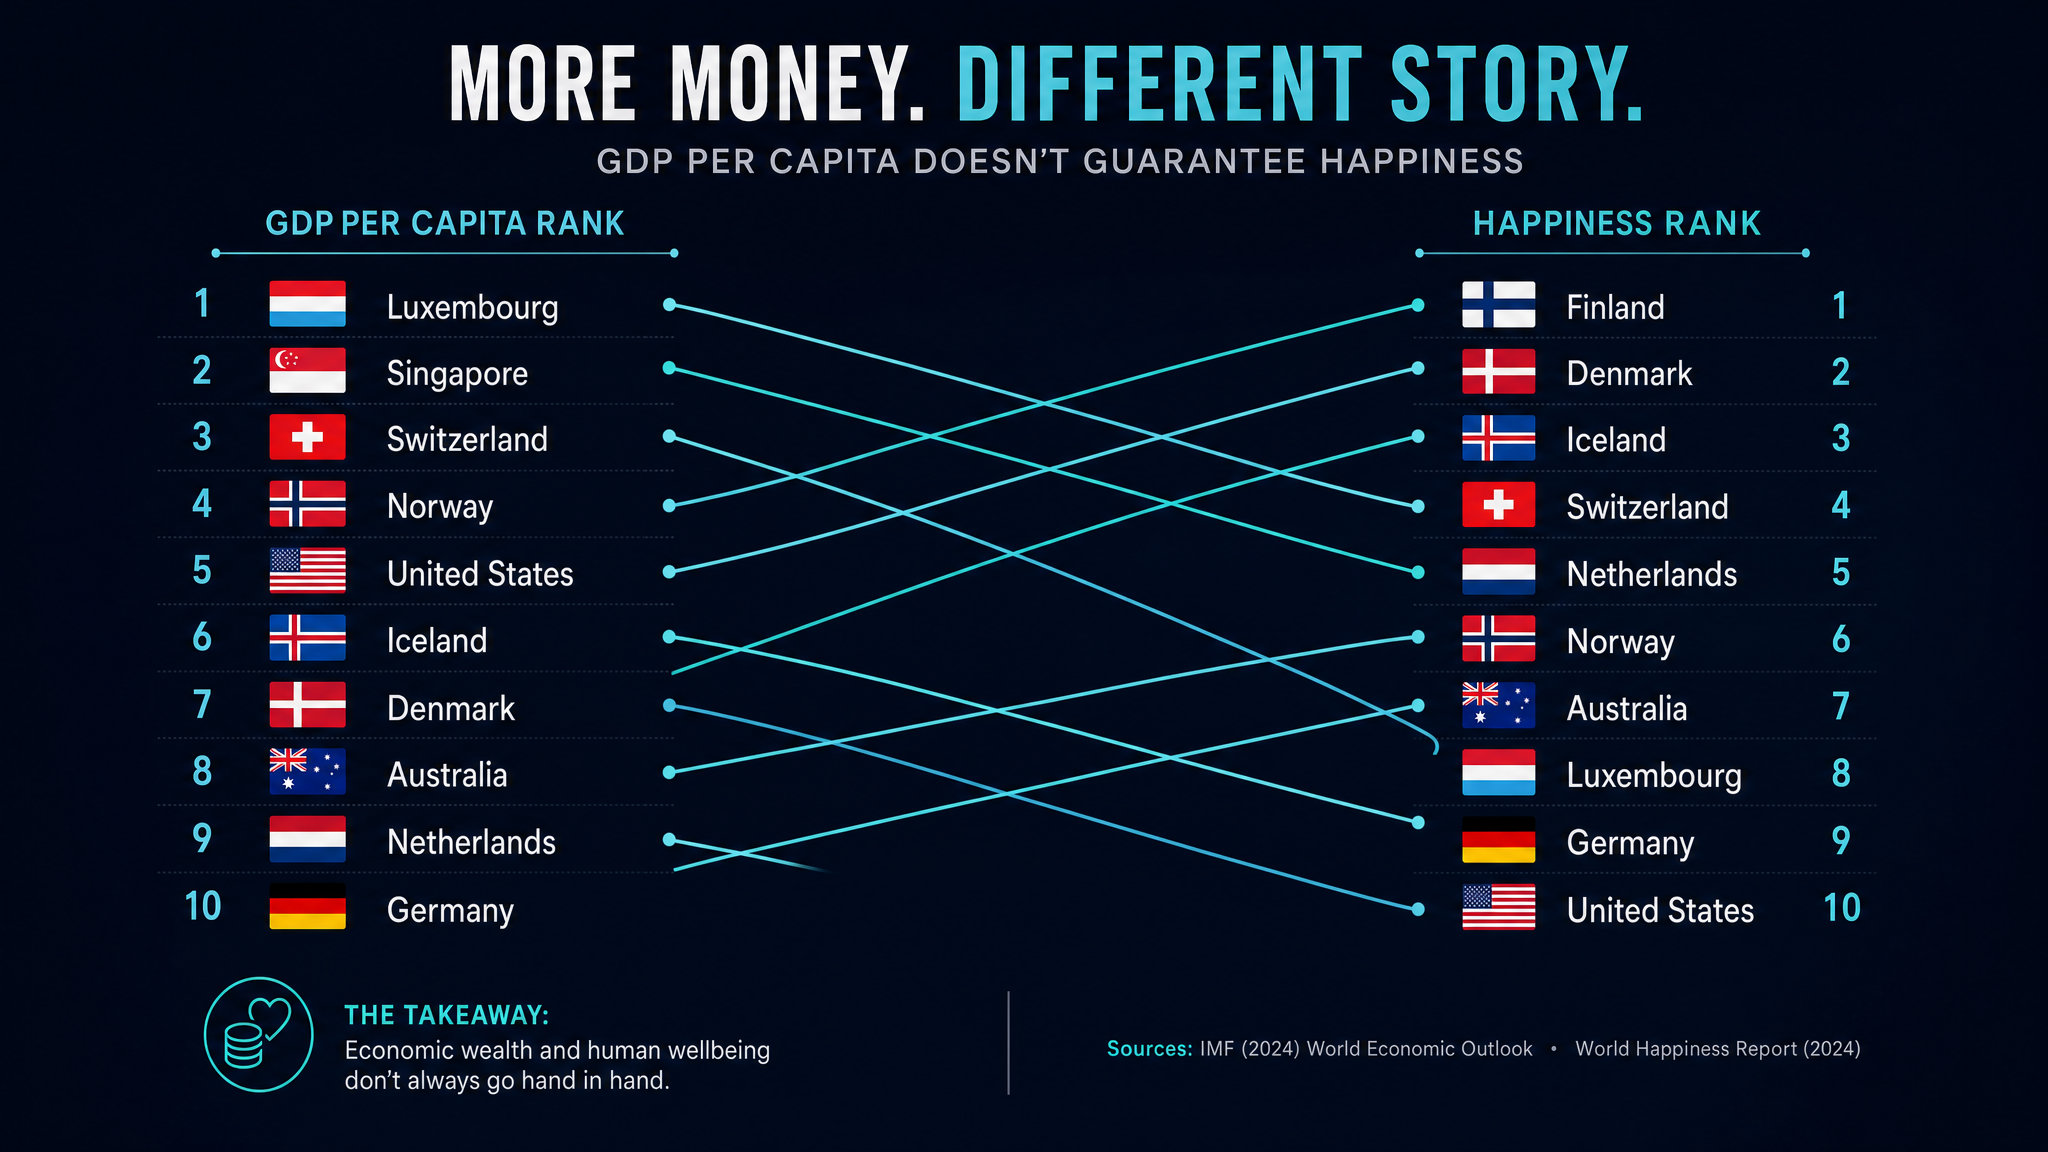
The data makes the divergence concrete. The United States has the highest absolute GDP of any nation on earth, and one of the highest GDP per capita figures. By the measure we use to declare national success, the US is near the top of every list.
By human outcome measures, the picture is different — and in some cases, startling.
| Country | GDP per capita rank | Life expectancy rank | Happiness rank (2024) | The gap |
|---|---|---|---|---|
| 🇺🇸United States | #5 | #46 | #23 | High income, lagging outcomes |
| 🇯🇵Japan | #27 | #2 | #51 | Modest income, exceptional longevity |
| 🇶🇦Qatar | #4 | #61 | #29 | Oil wealth, underperforming on outcomes |
| 🇨🇷Costa Rica | #64 | #35 | #12 | Modest income, exceptional wellbeing |
| 🇳🇴Norway | #3 | #8 | #7 | Consistent across dimensions |
| 🇸🇬Singapore | #2 | #3 | #30 | Rich and long-lived, but belonging gap |
Japan's GDP per capita is roughly half the US figure. Its citizens live an average of 84.3 years — nearly 7 years longer than Americans. Costa Rica has a GDP per capita of about $15,000, roughly one-sixth of the US. It ranks 12th in global happiness. Qatar has a GDP per capita among the five highest in the world, built on oil wealth, and it underperforms on nearly every human outcome measure that isn't directly purchasable.
These divergences are not anomalies. They are information. They tell us that once a country crosses a certain income threshold, additional economic growth produces diminishing returns on human wellbeing — and that the countries successfully converting economic output into actual human flourishing are doing something that GDP cannot see or measure.
The same divergence appears at the state level within the United States. California has one of the highest GDPs of any state or country in the world. It ranks 39th in the US on human progress measures that include housing affordability, homelessness, poverty, and social trust. West Virginia has one of the lowest GDPs. It also ranks near the bottom on human outcomes — but the drivers are entirely different from California's. GDP groups them both as "poor performers" without explaining why, or what to do about it.
"GDP groups California at $4 trillion and West Virginia at $100 billion as economic stories. Human progress measures reveal they are failing in completely different ways, for completely different reasons, requiring completely different responses."
What Humans Actually Pursue — The Nine Dimensions
In 1943, Abraham Maslow published a paper titled "A Theory of Human Motivation." His central claim: human beings are not random in what they want. They pursue a predictable hierarchy of needs — and they do not move up the hierarchy until the level below is reasonably secure.
At the base: physical survival. Food. Water. Shelter. Health. Once those are met, humans pursue safety — freedom from crime, economic insecurity, environmental harm. Once safe, they seek belonging — connection, community, love. Then esteem — achievement, recognition, agency. At the apex: self-actualization — the full expression of human potential.
Maslow was describing individuals. The Bold Arc Human Progress Index applies his framework to states and nations. The insight: countries don't develop randomly. They ascend the hierarchy in sequence. A country focused entirely on survival cannot prioritize self-actualization. A country where basic safety is secured can begin investing in education and connection. The stage a nation occupies on the hierarchy predicts what it needs next — and what a measurement system must capture to be useful.
GDP captures the fuel that powers the ascent. The Arc Index measures the ascent itself — across nine dimensions that correspond directly to the nine things human beings universally pursue.
These nine dimensions are not a policy agenda. They are a map of what human beings universally pursue — documented across cultures, geographies, and centuries. Maslow called them needs because you cannot choose not to have them. They are structural features of human psychology, not preferences. They are what the Arc of human progress is actually built from.
The Arc Score — Two Numbers That Tell the Full Story
Each dimension is scored 0 to 100 based on objective, publicly available data from sources including the CDC, FBI, Census Bureau, WHO, World Bank, Gallup, and OECD. The nine scores are weighted by the dimension's fundamental importance to human flourishing — Health & Longevity carries the most weight at 18%, Transcendence the least at 3% — and combined into a single composite: the Arc Level.
But the Arc Level alone — a snapshot of where a state or country stands today — misses half the story. A state ranked 40th that is climbing fast is a different story from a state ranked 10th that is declining. Which is why the Arc Index produces a second number: the Arc Momentum. Momentum measures the direction and pace of change — whether the arc is bending upward or downward, and how fast.
What the Index Is Not
The Bold Arc Human Progress Index is not a replacement for GDP. Economic data remains essential — it drives many of the dimensions the index measures. A state with a strong economy tends to have better healthcare, better schools, and more affordable housing than one without. Economic growth is the engine. The Arc Index measures whether the engine is actually moving passengers toward better lives.
The index is also not a political scorecard. The nine dimensions are designed to be as objective and politically neutral as data allows. A conservative state and a progressive state can both rank highly — or poorly — on the Arc Index. The data does not tell states what to value; it tells them how they are performing on the things their residents universally value, regardless of political label.
And it is not a simple ranking of "best" to "worst" states or countries. The Arc Level and Arc Momentum together produce a more nuanced picture: a state can lead on health and trail on housing. A country can excel on safety and fail on happiness. The dimension breakdown is where the real insight lives — and where the actionable information for policymakers, businesses, and residents is found.
"The Arc Index doesn't tell states what to value. It measures how they're performing on the things their residents universally value already."
What's Coming in September
In September 2026, Bold Arc will publish the first edition of the Bold Arc Human Progress Index — covering all 50 US states and countries around the world, scored across all nine dimensions on 2025 data.
Every state will receive an Arc Level score and an Arc Momentum score. The full dimension breakdown will be published for each state — showing not just where it ranks overall, but where it leads, where it lags, and what the trend line looks like over time.
The country index will show the same data at the national level — placing every country on the Maslow Economic Ascent map and revealing which nations are converting economic growth into actual human progress, and which are not.
Some of what the index shows will be expected. Some will be genuinely surprising. A few results will be uncomfortable. All of it will be grounded in data — the same publicly available, rigorously sourced data that any researcher can independently verify.
Between now and September, Bold Arc will publish a series of articles introducing each dimension of the index — starting with Health & Longevity next week. Each article will provide the current data picture, the state and country leaders and laggards, and the story behind the numbers. By the time the index releases, readers who have followed the series will know exactly what they're reading — and why it matters for their state, their community, and their life.