The oceans cover 361 million square kilometers of Earth's surface. They absorb most of the planet's solar radiation, generate their own kinetic energy through wind-driven waves and tidal forces, and circulate thermal gradients across thousands of meters of depth. They have been doing this for billions of years. And for almost the entire history of human civilization, we have used exactly none of it for electricity.
That's changing. Offshore wind is now one of the fastest-declining-cost energy technologies on the planet. Wave and tidal devices are beginning the same cost curve that solar panels started in 2005. Floating platforms are unlocking deep-water sites that fixed foundations could never reach. And the electric potential sitting off the world's coastlines dwarfs anything that can be built on land.
The pessimist case — that offshore wind is too expensive, that ocean energy is a niche that will never scale, that the sea is too hostile an environment for reliable industrial infrastructure — is not looking at the data. The same curve that made solar the cheapest electricity in history is running again, at sea.
The Solar Curve Is Happening Again, at Sea
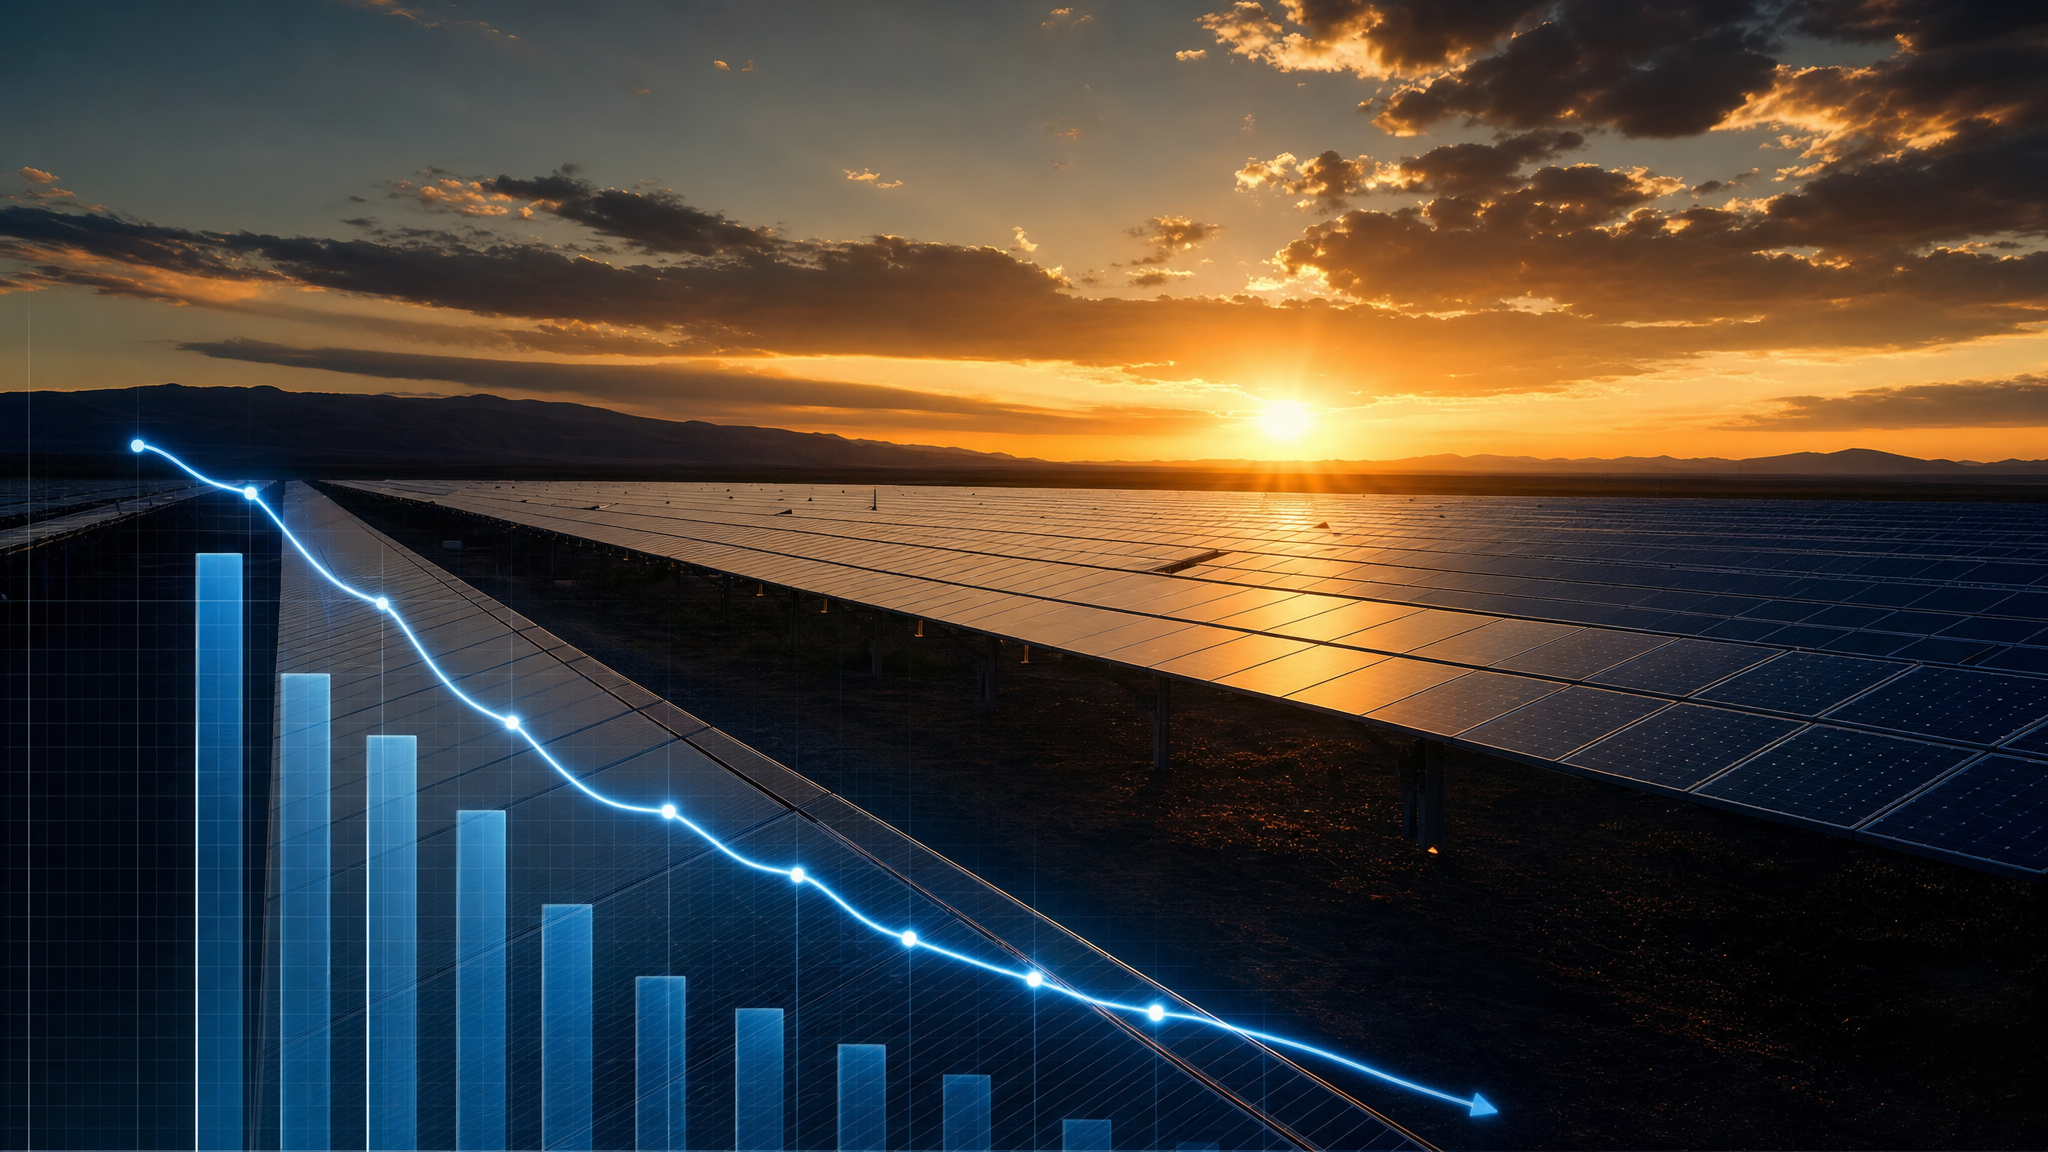
In 2010, offshore wind electricity cost roughly $180 per megawatt-hour. Expensive, slow to permit, technically demanding. The turbines were small — 2 to 3 megawatts each. The foundations were custom-engineered for each site. The supply chains barely existed.
By 2024, offshore wind costs had fallen to approximately $60–80/MWh in mature markets — a decline of more than 70% in 14 years. That trajectory follows the same learning curve pattern documented in solar: for every doubling of cumulative capacity, costs fall by a predictable percentage. The mechanism is identical. More installations mean optimized supply chains, standardized components, more experienced installation crews, improved turbine designs, and better site-assessment tools.
The turbines themselves tell the story. In 2010, a 2–3 MW turbine was industry standard. By 2025, the industry entered the year with commercial turbines at 15–20 MW — units six to eight times more powerful per machine. Fewer turbines per site. Less steel per megawatt. Less installation time. More electricity per dollar spent.
Individual 15 MW turbines now have rotor diameters exceeding 220 meters — blades the length of two football fields, spinning through air mass so large that a single rotation generates enough electricity to power a typical home for more than a day. These machines would have seemed fantastical in 2010. They are now in volume production.
The same pattern is visible in the supply chain. Specialized installation vessels — jack-up ships that raise themselves on legs above the ocean surface to install turbines in calm stability — now operate as a global fleet. Port facilities built specifically for offshore wind have opened across Europe, the US, and Asia. The whole industrial ecosystem that solar required to scale has been built, or is being built, for offshore wind.
75 Gigawatts and Accelerating
Global offshore wind capacity reached approximately 75 gigawatts installed by the end of 2024. That number understates the momentum: a pipeline of projects under construction or in advanced permitting stages would roughly double installed capacity within three to four years under current development schedules.
Even 2024 — a year widely described in energy media as a "slowdown" for offshore wind, due to inflation-driven contract cancellations in the US and UK — still saw approximately 30 gigawatts of new offshore wind leases awarded globally. A slowdown year added 30 GW of new lease commitments. For context, that's more than the entire installed solar capacity of the United States in 2012.
The UK is the clearest example of what scale looks like. On record days in 2024, more than 40% of UK electricity came from wind — much of it offshore. This is not a laboratory result. It is a live grid with 65 million people, meeting peak demand in real time with wind turbines in the North Sea. The grid did not collapse. The lights stayed on. The cost of electricity fell when the wind blew hard.
Denmark, which has operated offshore wind longer than any other country, gets over half its annual electricity from wind. Germany, the Netherlands, Belgium, and Taiwan are building at scale. China — as with solar — is building faster than anyone else, targeting 200 GW of offshore wind by 2030.
The scale question — "can this ever be big enough to matter?" — was answered years ago. The remaining questions are about permitting timelines, supply chain bottlenecks, and grid integration. Those are real challenges. They are also the challenges that any new industrial infrastructure faces as it scales from prototype to backbone.
The Deep Water Problem — And How Floating Platforms Solved It
Fixed-foundation offshore wind turbines — the kind that stand on steel monopiles driven into the seabed — work well in water depths up to roughly 50 meters. Below that, the engineering becomes prohibitively expensive. The foundations get too large, too heavy, too costly to install.
The problem is that most of the world's best offshore wind resource sits in deep water. Approximately 90% of the global offshore wind potential is in sites deeper than 60 meters — effectively inaccessible to fixed-foundation technology. The shallow-water sites that made European offshore wind viable are the exception, not the rule.
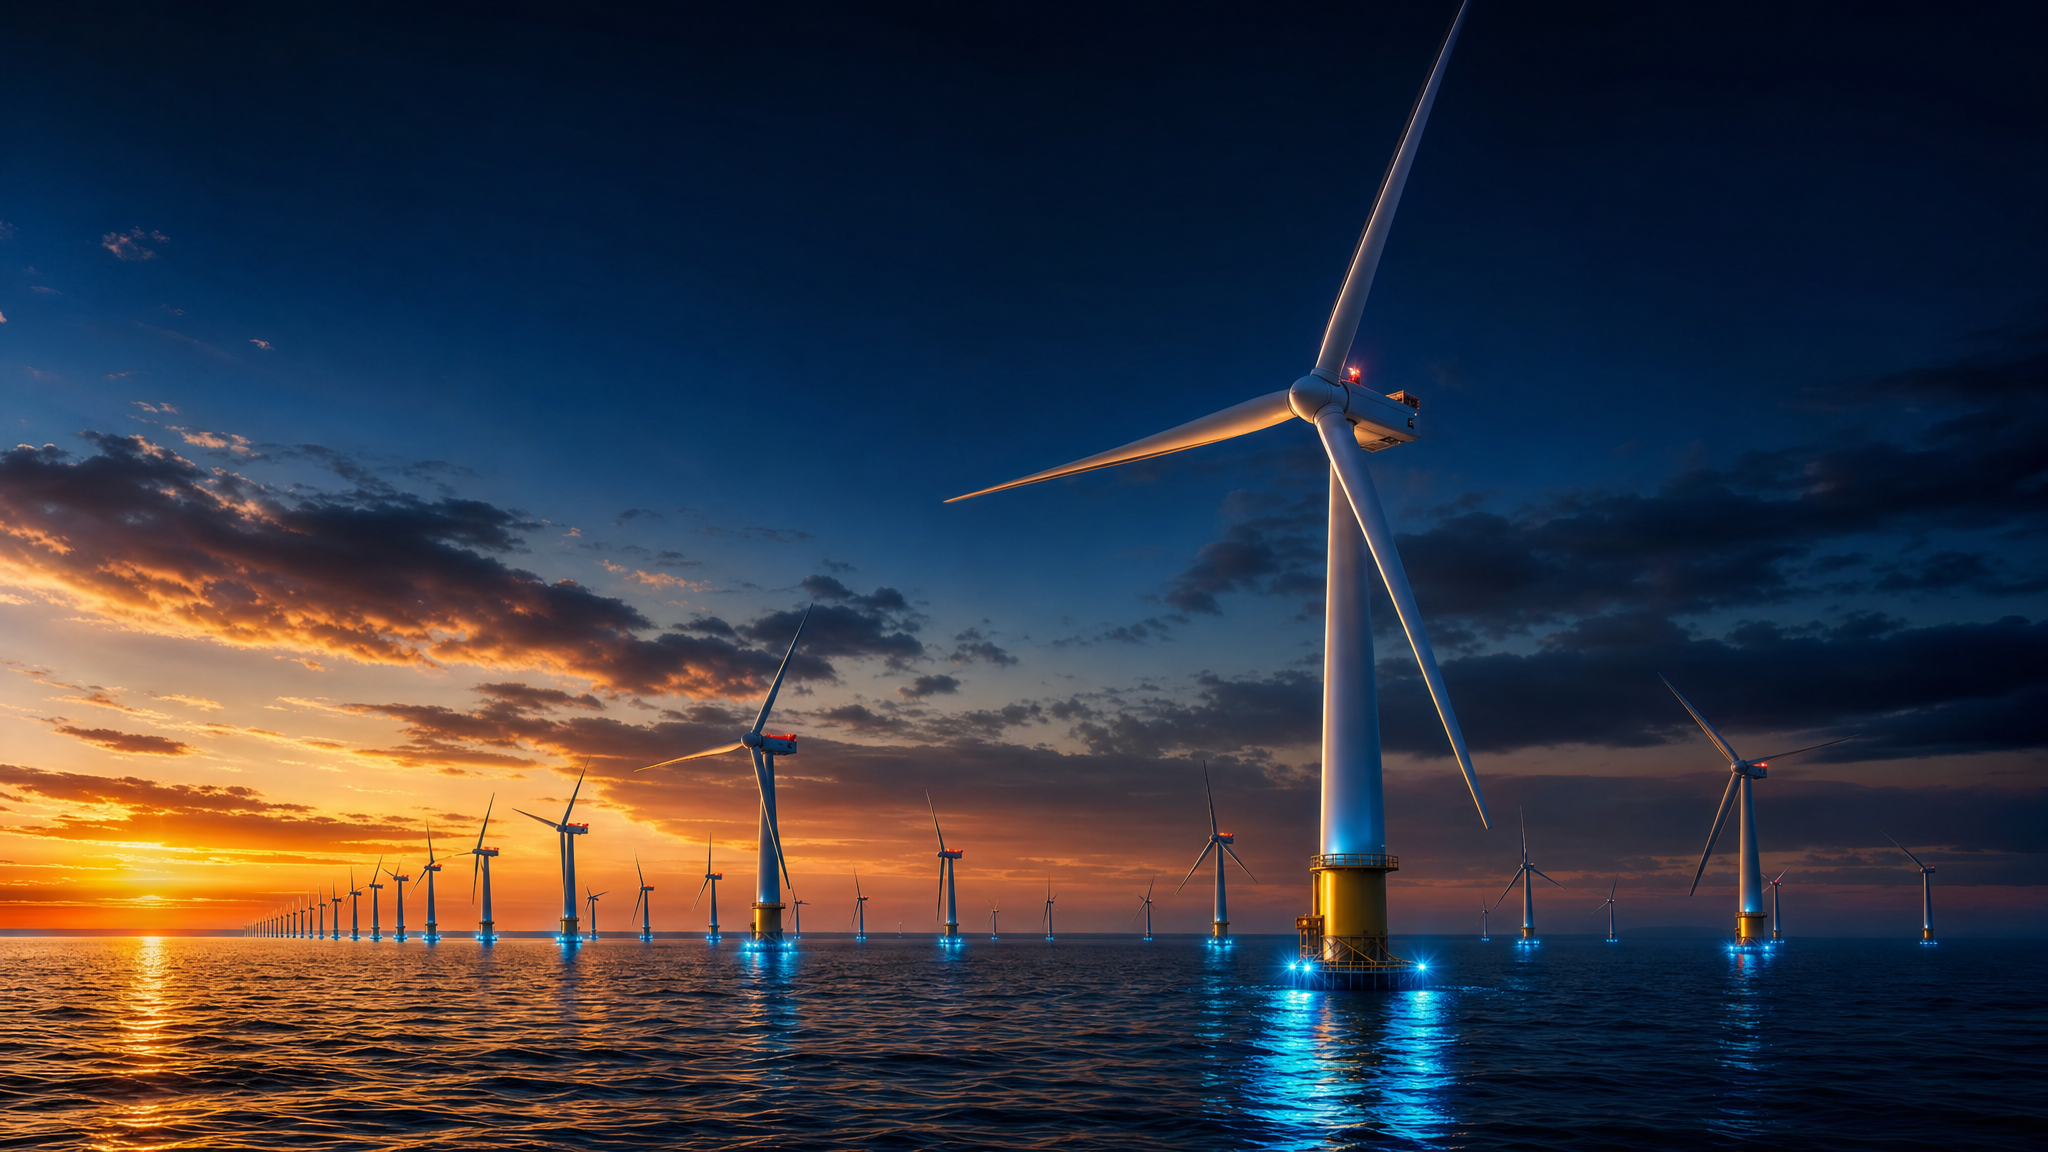
Floating offshore wind platforms solve this constraint. Instead of a fixed foundation, a floating turbine sits on a buoyant hull — similar in principle to the tension-leg platforms used by the oil industry for decades — anchored to the seabed by mooring cables. The turbine floats at the surface, moves slightly with waves, and generates electricity regardless of the depth below.
Norway's Hywind Tampen project, commissioned in 2022, is the world's largest floating wind farm. Its 11 turbines generate electricity for oil platforms in the North Sea that previously ran on diesel generators — a striking image of transition. An oil-producing nation using floating wind to power its oil platforms. The economics made it worth doing even for Equinor.
Floating wind costs are still higher than fixed-foundation offshore wind — roughly $100–130/MWh in current projects. But that cost trajectory will fall as the technology scales, just as fixed-foundation offshore wind fell from $180 to $60. The question is not whether floating wind will become cost-competitive. It is when. Current estimates from the IEA and BloombergNEF put meaningful cost parity at the early-to-mid 2030s.
When floating wind reaches commercial scale, the resource picture changes entirely. Japan, South Korea, the US West Coast, the Mediterranean, and most of Southeast Asia — geographies that lack shallow coastal shelves — all become viable offshore wind sites. The 90% of the resource that was locked in deep water becomes accessible.
"Tidal energy is 100% forecastable, 100 years in advance. No other energy source on Earth can say that. When the world figures out how to harvest it at scale, intermittency arguments against renewables become an antique debate."
Wave and Tidal: The 2005 Moment
In 2005, solar photovoltaic electricity cost approximately $300–400 per megawatt-hour. It was a curiosity — interesting to engineers, economically marginal everywhere. The learning curve had been running for decades, but the scale was still small. Most people writing about energy didn't think solar would ever be cheap enough to compete with fossil fuels.
Wave and tidal energy are at approximately that stage today.
The Electric Power Research Institute estimates wave energy's global technical potential at 2.1 terawatts. The US coastline alone has wave energy potential equivalent to roughly 17% of current US electricity demand. These numbers sit untapped because harvesting wave energy at commercial scale remains technically and economically challenging. The devices work. The learning curve hasn't run far enough yet to bring costs down to grid-competitive levels.
Tidal energy — generated by the predictable rise and fall of ocean tides, driven by the gravitational pull of the moon and sun — has a property no other energy source on Earth possesses: complete predictability. Tidal flows can be forecast 100 years in advance with high precision. No clouds, no calm days, no weather variability. Tidal turbines in high-flow channels generate electricity on a schedule that grid operators can plan around.
Meygen, off the northern coast of Scotland in the Pentland Firth, is the world's largest operational tidal stream project. It operates commercial-scale turbines anchored to the seabed in one of the fastest tidal currents in Europe. The project has delivered consistent electricity to the grid since 2016. It is small by power system standards. It is proof of concept at commercial scale.
The same cost-reduction dynamic that drove solar and offshore wind is beginning to operate in wave and tidal. Each device that gets deployed gives engineers data. Each iteration improves reliability, reduces material costs, and de-risks the financing of the next project. The EPRI and the IEA both project wave and tidal costs declining significantly through the 2030s as the installed base grows.
Ocean Thermal Energy Conversion — OTEC — adds another dimension. In tropical and subtropical regions, the temperature difference between warm surface water (25–29°C) and cold deep water (4–7°C) can drive a thermodynamic cycle that generates electricity continuously, day and night, every day of the year. The resource is vast in the tropics. The engineering challenge is building pipes long enough to draw cold water from depth economically. Early commercial demonstration projects are underway.
None of these technologies are ready to displace fossil fuels tomorrow. All of them are on learning curves that have proven, in solar and in fixed offshore wind, to produce dramatic cost reductions once scale begins to accumulate.
What Ocean Energy Means for the Arc
The 750 million people who still lack reliable electricity access are disproportionately concentrated in coastal and island communities — Southeast Asia, sub-Saharan Africa's coastline, Pacific island nations, parts of South Asia. These are precisely the communities that offshore and ocean energy can serve directly, without the long transmission lines that landlocked renewable development requires.
Island nations — which currently import diesel fuel at enormous cost to run generators — are natural early markets for offshore wind, wave, and tidal systems. The Marshall Islands, Tuvalu, Kiribati: these communities spend 30–50% of GDP on imported fuel. A local offshore wind or wave energy system, once built, has near-zero fuel costs. The economics are compelling even at current technology costs, in the right geographies.
For climate, the math is stark. The IEA's net-zero scenario requires the world to produce roughly 10,000 terawatt-hours of electricity from offshore wind by 2050 — up from roughly 400 TWh today. A 25-fold increase. That requires scale-up at a pace comparable to what solar achieved from 2010 to 2025. The learning curves, the supply chains, and the capital formation required to do that are not fantasies. They are the same processes that built the solar industry — now being applied to a larger platform.
The ocean-energy transition also matters for the broader Blue Economy: the same offshore platforms that generate electricity can co-locate aquaculture infrastructure, provide charging points for ocean-going autonomous vehicles, support marine scientific monitoring, and eventually become nodes in a distributed offshore grid. The infrastructure, once built, is multipurpose.
Submarine cables already carry 99% of international internet traffic — the entire global communications infrastructure runs along the ocean floor. Co-locating energy infrastructure with communications infrastructure on shared platforms and corridors is an emerging design concept. The ocean is not just a power source. It is becoming an infrastructure platform.
Arc Close
The case for offshore energy doesn't rest on optimism. It rests on the same learning curve that made solar — dismissed for decades as economically marginal — the cheapest electricity source in history. That curve ran in solar panels. It is running in offshore wind turbines. It is beginning to run in wave and tidal devices. The mechanism doesn't change because the technology is wet.
By 2035, offshore wind will be among the cheapest forms of electricity available in the world's most resource-rich coastal regions. Floating platforms will have opened deep-water sites across Asia, North America, and the Mediterranean. Wave and tidal projects will have moved from demonstration to early commercial deployment, beginning the cost-reduction cascade that follows every technology once it reaches meaningful scale.
The ocean has been absorbing solar energy, generating kinetic energy, and cycling thermal gradients for longer than life has existed on Earth. What's new is that we have finally built machines capable of converting some fraction of that energy into electricity that humans can use. The machines are getting better, faster, and cheaper. The resource is effectively infinite.
The power plant covering 71% of the Earth's surface has barely been switched on. The switch is turning.