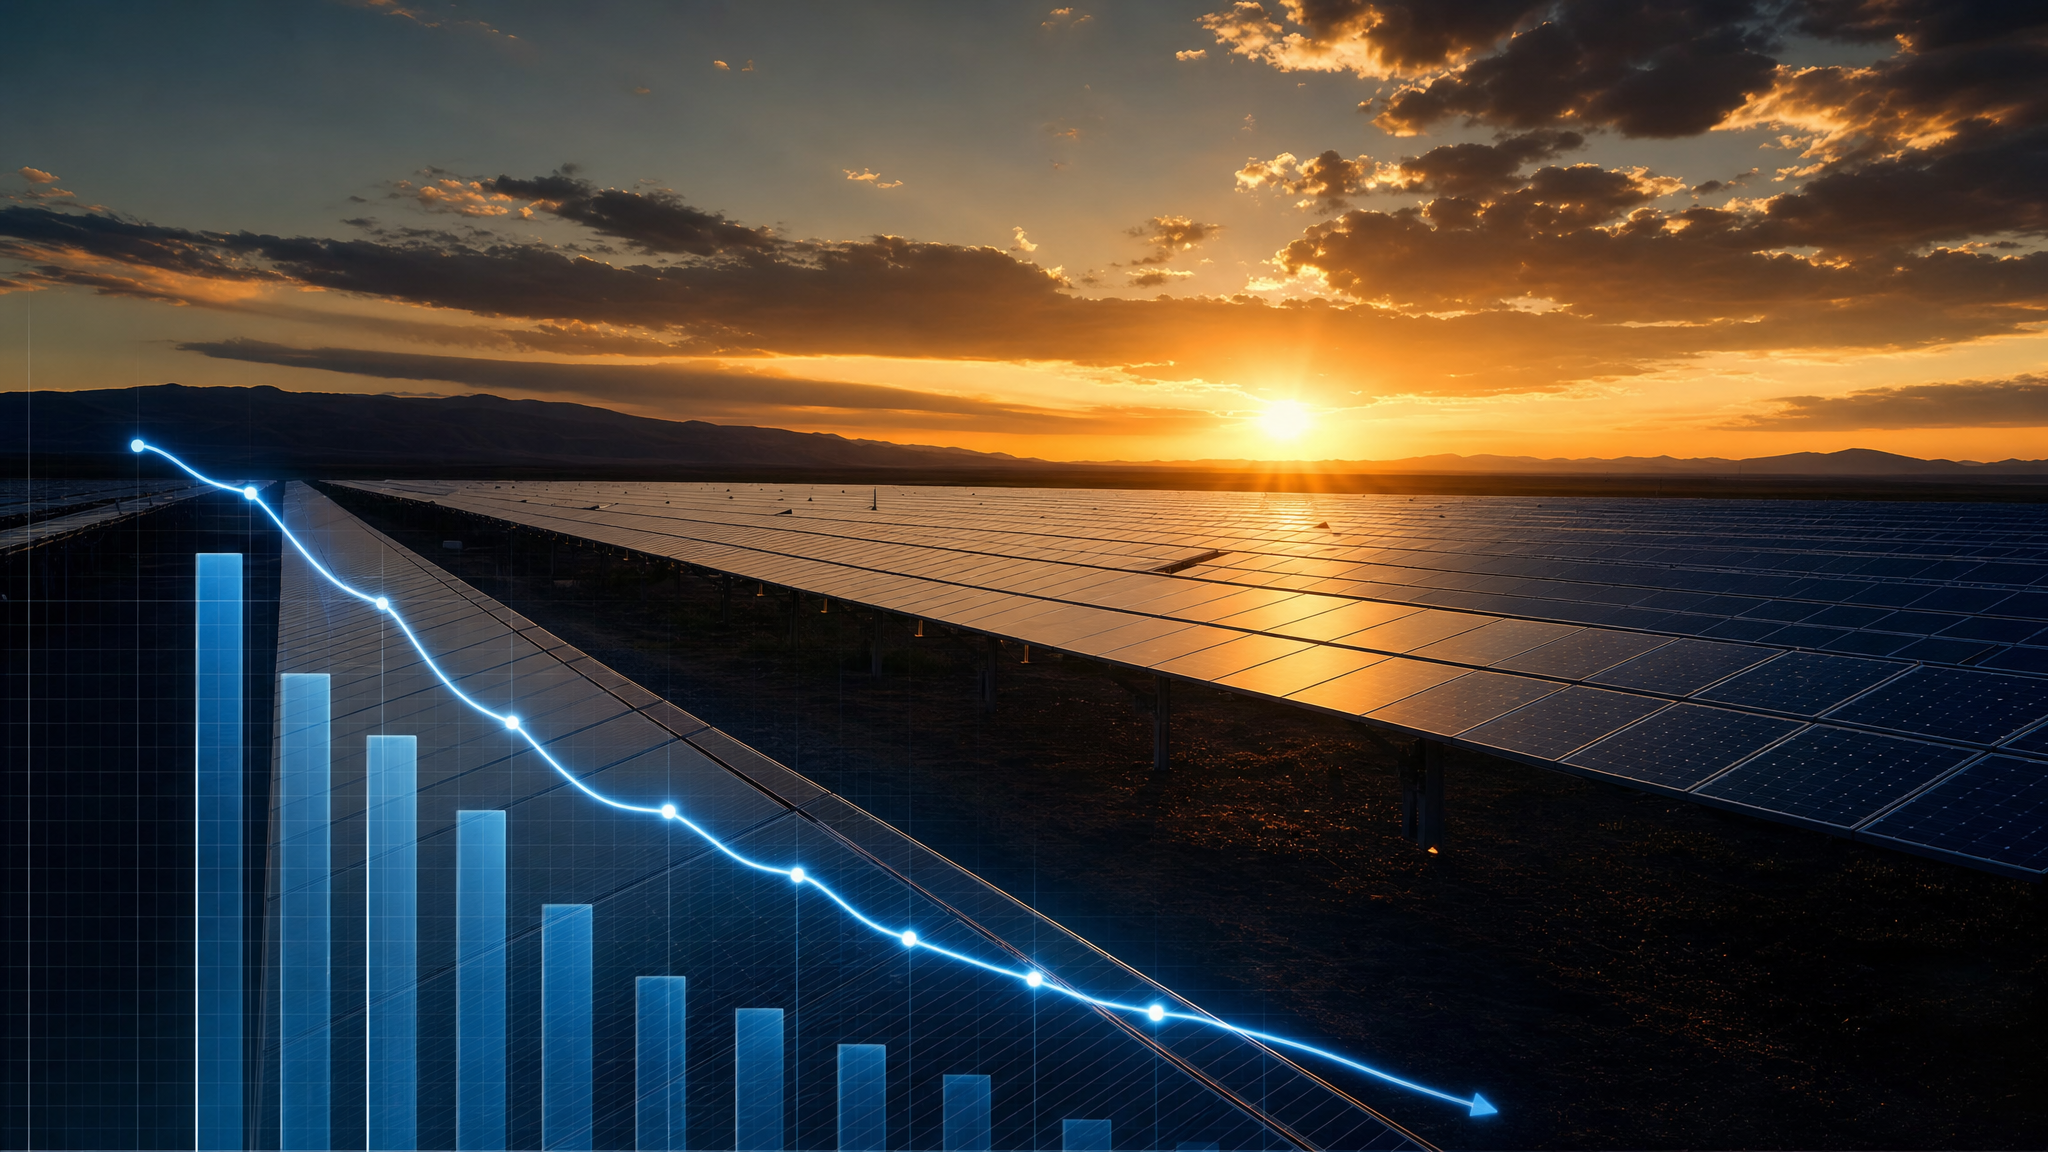
In 2010, solar electricity cost $101 per megawatt-hour. That was already a staggering fall from the $1,800/MWh of the 1970s. Analysts who called solar promising were considered optimists. Analysts who called it competitive with fossil fuels were considered delusional.
By 2023, the cost had fallen to $29/MWh globally. In the best markets — parts of the Middle East, India, Chile — solar is now being contracted for under $20/MWh. That is cheaper than running an already-built coal plant. Not cheaper to build — cheaper to run. The fuel is free. The sun shows up every day.
That 90%+ decline in 13 years is not a rounding error. It is the fastest sustained cost reduction of any energy technology in recorded history. And the curve is not flattening.
The Law Behind the Drop
In 1976, Stanford professor Richard Swanson observed something striking: for every doubling of cumulative installed solar capacity, the cost of solar panels fell by roughly 20%. He was documenting, not predicting. But the pattern held for decade after decade — through oil shocks, recessions, technology transitions, and political headwinds.
Swanson's Law is solar's version of Moore's Law for semiconductors. Both describe learning curves: as more of something gets manufactured, the process gets more efficient, defects get eliminated, supply chains get optimized, and the cost per unit falls. In semiconductors, the doubling time is roughly 18 months. In solar, doublings take longer — but the cost reduction per doubling has proven remarkably stable.
Global solar capacity was 40 gigawatts in 2010. By 2023 it had reached 1.2 terawatts — a 30-fold increase. Every doubling along that curve drove another 20% cost reduction. The math produces a 90%+ decline. The physics and engineering delivered exactly what the learning curve predicted.
No subsidies explain this curve. Subsidies accelerated deployment, which accelerated learning, which accelerated the cost reduction. But the mechanism is the learning curve itself — the same mechanism that made integrated circuits, hard drives, and LED lights 99% cheaper than their original costs.
What 1.2 Terawatts Actually Means
Scale is hard to visualize in energy. One terawatt of solar capacity, operating at average global capacity factors, generates roughly 1,400 terawatt-hours of electricity per year. For comparison, the entire United States consumed about 4,000 terawatt-hours in 2023.
The 1.2 terawatts now installed globally is not trivial. It is a meaningful fraction of world electricity production. And the pace of installation is accelerating, not slowing. In 2023 alone, the world added approximately 400 gigawatts of new solar capacity — more than in any prior year, and more than the total installed base just eight years earlier.
China installed more solar in 2023 than the entire United States had ever installed cumulatively. That sentence should stop you for a moment. China's 2023 additions alone exceeded America's entire decades-long solar buildout. This is not a story about one country's policy choices. It is a story about the economics of a technology that has become irresistible at scale.
India's solar costs are now under $25/MWh — cheaper than building new coal plants in India, a country that historically staked its development path on coal. The economics are forcing a transition that no climate agreement could compel.
The Storage Problem — And What's Happening to It
The standard pessimist rebuttal to solar's cost advantage has always been: "But the sun doesn't shine at night." This is true. It has also been the primary intellectual refuge of those who argued solar could never be a serious baseload power source.
The rebuttal is losing ground fast.
The same learning curve dynamic that drove solar costs down has been driving battery storage costs down — by roughly 90% since 2010 as well. The IEA reported in 2023 that solar paired with battery storage is now cost-competitive with natural gas peaker plants in the United States. Peaker plants — the gas turbines that spin up during peak demand — were the last stronghold of the "solar needs backup" argument. That stronghold is falling.
The catastrophist prediction was: renewables could never be baseload without massive storage subsidies. The data from 2023 markets: solar-plus-storage at $35–45/MWh is now undercutting gas peakers at $60–90/MWh in multiple US markets. The subsidies accelerated the timeline. The economics now stand without them in the best markets.
In 2023, Solar and Wind Accounted for 90% of New Capacity
The IEA's 2024 electricity report contained a number that represents a structural shift in the energy system: in 2023, solar and wind together accounted for 90% of all new electricity generation capacity added globally. Not new renewable capacity. All new capacity of any kind.
Coal plants still exist. Gas plants still get built. Nuclear operates. Hydro runs. But when the world's utilities and developers put capital to work building new generation, nine out of ten megawatts are going into wind and solar. This is not because of mandates. It is because that is where the economics point.
The energy transition is not a political project that might or might not happen depending on election outcomes. It is an economic transition that is happening, driven by prices, driven by learning curves, driven by the compounding mathematics of technology deployment. Policy shapes the pace. It does not reverse the direction.

