
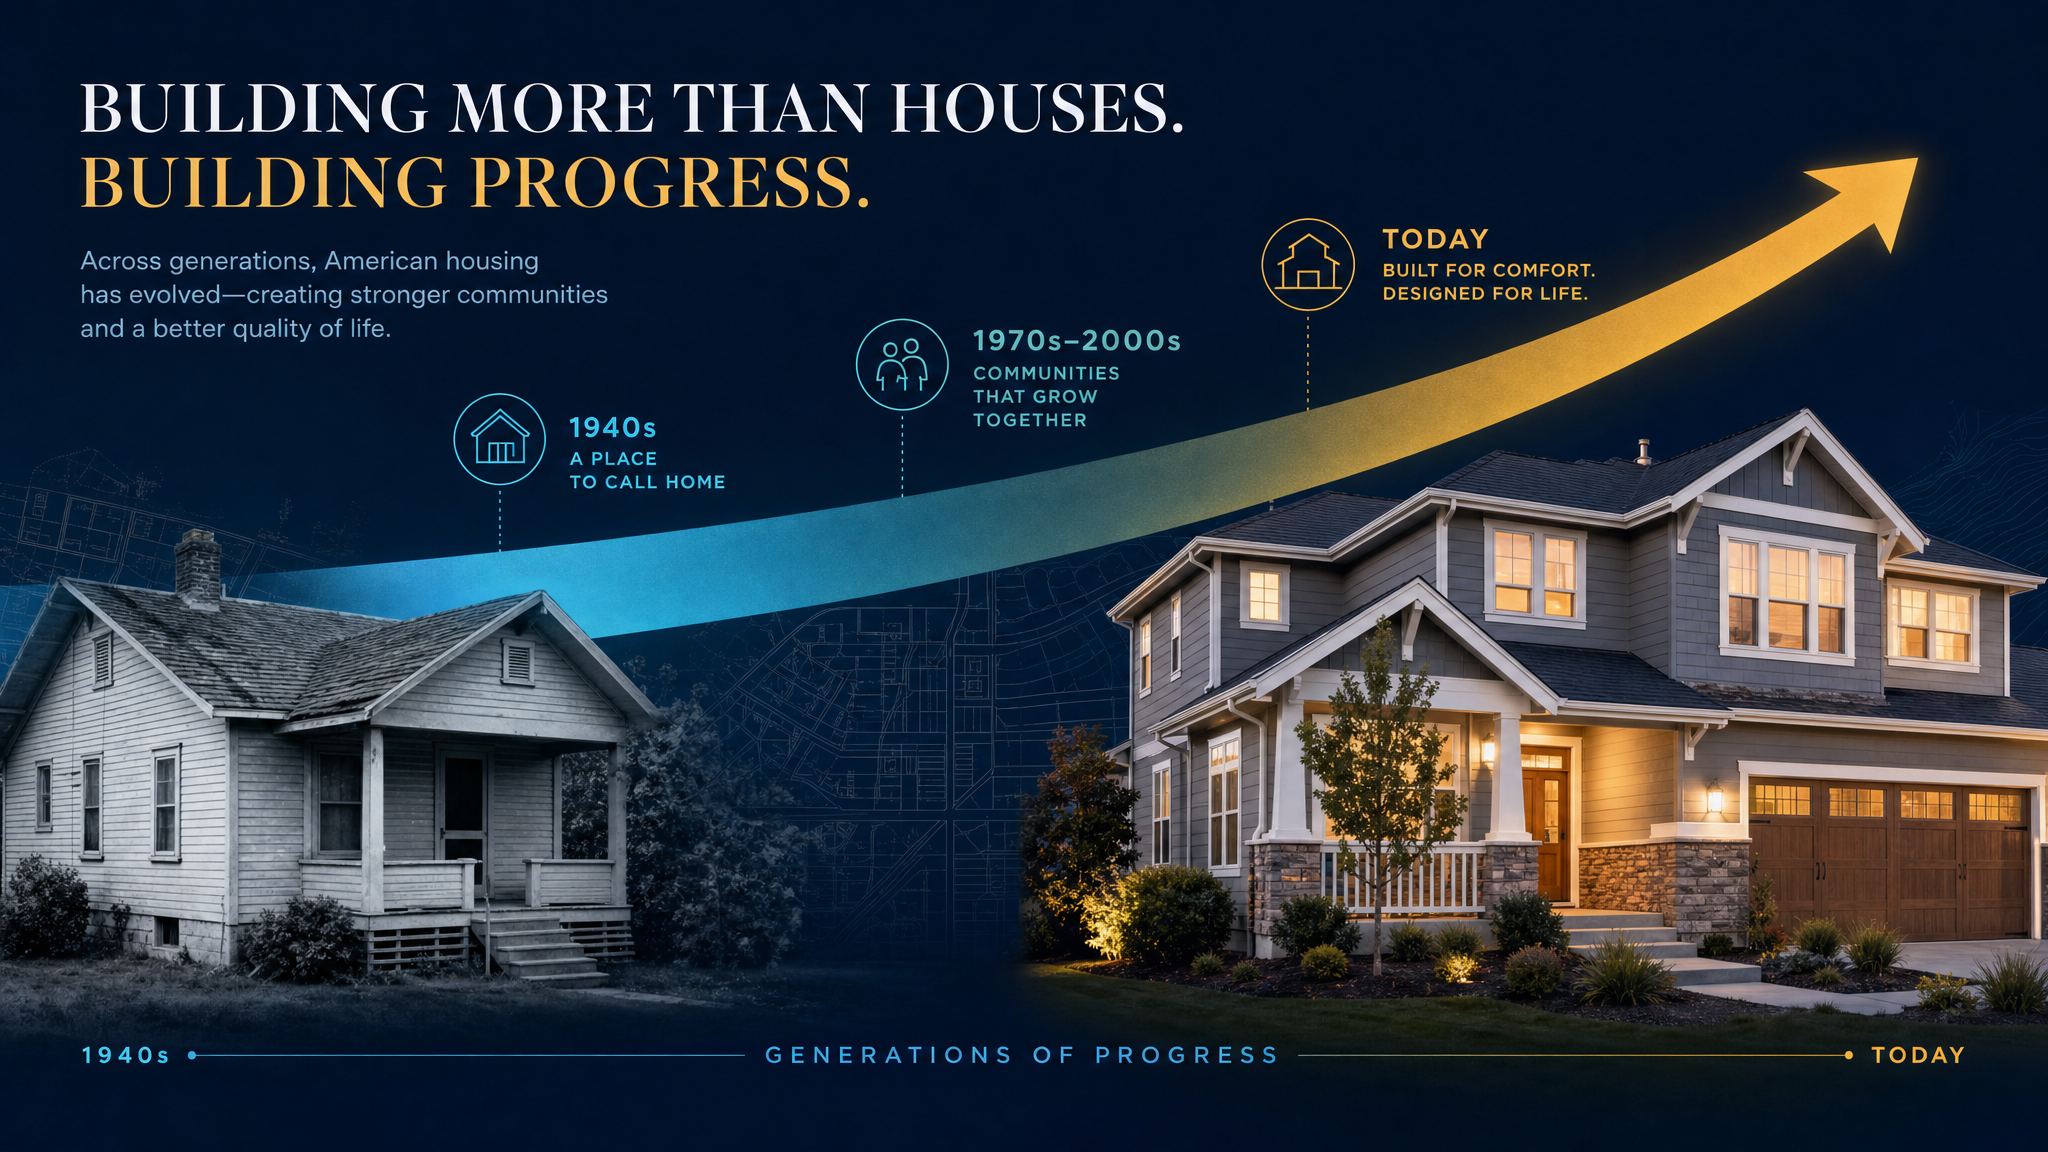
In 1940, nearly half of American homes lacked complete indoor plumbing. Families shared outhouses, hauled water, and lived in conditions that modern code enforcement would condemn without hesitation. Today, fewer than 1% of U.S. homes are without complete plumbing. That is not a government program. That is not luck. That is the compounding result of market competition, private investment, and the price mechanism delivering what families wanted — faster, cheaper, and better — with each passing decade.
The pessimist narrative holds that housing has gotten worse for everyone: rents are up, homeownership is down from its peak, and a generation of young Americans can’t afford to buy. The data tells a more complicated — and more hopeful — story. Housing costs have become a genuine pressure point. But the quality of shelter that Americans occupy — its safety, its size, its durability, its infrastructure — has undergone one of the most dramatic improvements of any measurable human condition in the last century.
What American Homes Actually Looked Like in 1940
The 1940 Census captured the baseline. The picture is stark: 46% of American homes lacked complete plumbing facilities. Only 79% had electricity — meaning roughly one in five homes cooked, lit, and heated by methods unchanged since the 1800s. The average American home measured roughly 1,000 square feet. Central heating was a luxury. Air conditioning was a commercial novelty.
Of Americans who rented — nearly 56% of households at the time — nearly half lived in conditions that Census definitions labeled substandard: overcrowding, structural deficiencies, or absent basic services. This wasn’t a crisis in the modern sense of “I can’t afford the neighborhood I want.” This was shelter that failed at the most elemental function of protecting human health.
The Quiet Revolution: Infrastructure Reaches Every Home
The electrification of American housing wasn’t led by federal mandate — it was pulled forward by private utilities competing for customers and by falling technology costs that made grid extension economically viable. By 1960, 99% of American homes had electricity. That 20-point leap in two decades didn’t happen because bureaucrats decided it should. It happened because the market for household appliances — refrigerators, televisions, washing machines — created relentless demand that made electrification profitable.
Plumbing followed the same curve. As mass-produced copper and PVC piping reduced installation costs, and as competing contractors drove down labor rates, complete indoor plumbing ceased to be a luxury and became the baseline expectation for any rentable or saleable property. By 1980, the share of homes without complete plumbing had fallen to under 3%. Today it sits below 1%.
Central heating moved from 26% of homes in 1940 to near-universal coverage by the 1970s. Central air conditioning went from statistical rarity to majority adoption by the 1980s — a transformation driven by falling compressor costs as manufacturers competed on price and efficiency. Market competition did what policy rarely accomplishes: it delivered better quality at lower relative cost, year after year.
Size, Safety, and Standards: The Floor That Kept Rising
The average American home in 2024 measures approximately 2,300 square feet — more than double the 1940 figure. That’s not a story of conspicuous consumption. For most of that period, it’s a story of families gaining space that allowed children to have rooms, adults to have privacy, and households to function as stable units rather than overcrowded arrangements.
The structural safety transformation is equally dramatic. Post-WWII housing codes, driven largely by insurance industry requirements and lending standards, steadily eliminated the fire-trap construction that dominated pre-war stock. The proliferation of smoke detectors — driven by falling sensor costs and eventually code requirements — cut residential fire deaths by more than 50% between the 1970s and today.
Among renters, the quality shift is perhaps most striking. In 1970, Census data showed 49% of renters occupied housing that met the definition of substandard — inadequate plumbing, heating, or structural soundness. By 2020, that figure had fallen below 5%. The mechanism was not primarily housing assistance programs, which reached a small fraction of renters. The mechanism was private construction responding to demand: as wages rose, renters demanded more and got more. Landlords who couldn’t provide it lost tenants to those who could.
The Homeownership Curve: What the Peak and Dip Actually Mean
Homeownership reached 44% in 1940. It climbed steadily through the postwar decades, touching 69% at the 2004 peak — the highest in American history — before the financial crisis drove it back to approximately 65% today.
The pessimist reads the drop from 69% to 65% as evidence of systemic failure. The fuller picture is more nuanced. The 2004 peak was partly an artifact of mortgage markets that were systematically underpricing risk — a distortion that eventually collapsed under its own weight. The current 65% rate sits above every pre-1990 reading except the tail end of the 1980 boom. More Americans own their homes today, as a share of households, than at any point before 1990.
The genuine cost problem is real and should not be minimized. Poverty-level constraints on household formation interact with housing costs in ways that compound disadvantage. But the claim that housing has gotten worse for everyone conflates cost — which has genuinely increased in high-demand markets — with quality, which has increased almost everywhere.
Manufactured Housing: The Market Mechanism Nobody Talks About
The single most underreported story in American housing is manufactured housing. Factory-built homes now account for roughly 10% of the U.S. housing stock and represent the largest source of unsubsidized affordable housing in the country. The cost advantage is structural: factory production eliminates weather delays, reduces material waste through precision cutting, and allows bulk purchasing that site-built construction cannot match.
The price curve for manufactured housing has tracked the same dynamic that clean water infrastructure and health improvements have followed globally: private capital invested in process efficiency produces better outcomes at lower cost over time. A modern manufactured home built to HUD code standards provides structural integrity, energy efficiency, and complete plumbing that would have been unattainable for most working-class families in 1960.
The constraint on manufactured housing’s market share isn’t quality — modern units routinely outscore comparable site-built homes on energy performance metrics. The constraint is zoning: most residential zones in America explicitly prohibit manufactured housing through minimum square footage requirements and “site-built only” language. Where zoning allows it, the market delivers quality shelter at prices that expand access.
For readers who want to understand the forces shaping American housing markets, The Color of Law by Richard Rothstein and Order Without Design by Alain Bertaud offer two essential perspectives — one on how policy shaped racial access to housing, the other on how urban economics actually functions. Both are available via Amazon (The Color of Law, Order Without Design).
What’s Coming: The Next Arc of Housing Quality
Three technology curves are converging in ways that could do to housing costs what electrification did to lighting costs in the 1950s.
3D-printed construction has moved from prototype to commercial deployment. Companies in Texas, California, and Europe are printing single-family homes at costs 20–40% below conventional site-built comparables. The market mechanism is straightforward: labor is the largest cost variable in site-built housing, and 3D printing eliminates most of it. As the technology matures and more printers enter production, competitive pressure will drive costs lower.
Mass timber — engineered wood products like cross-laminated timber (CLT) — is enabling mid-rise and high-rise construction that previously required steel and concrete. The cost curve favors mass timber as manufacturing scale increases. The sustainability case accelerates adoption, but the economics are the engine.
Zoning reform is slower but gaining real momentum. Minneapolis eliminated single-family zoning citywide. California enacted broad upzoning legislation. Oregon, Montana, and several other states have passed laws overriding local exclusionary zoning rules. The economic argument has finally broken through the political resistance that kept housing supply constrained for decades: exclusionary zoning raises housing costs, and the evidence is now too strong to dismiss. The improvements in life expectancy and health outcomes that define human progress depend on people having stable, quality housing — and that requires supply.
For a deeper look at the economics and history of housing in American cities, Homelessness Is a Housing Problem by Gregg Colburn and Clayton Page Aldern (Amazon) provides the data that cuts through the policy noise.
The Verdict: Quality Up, Costs Up, More Progress Ahead
The housing picture in America is not simple. Costs in high-demand metros have increased faster than incomes for a decade, and that is a real problem with real consequences for real families. Child mortality declines and poverty reduction globally have been accompanied by urbanization — and urbanization strains housing supply in predictable ways.
But the claim that housing has gotten worse for everyone is wrong on the data. The homes Americans live in today are safer, larger, better-equipped, and more structurally sound than at any previous point in history. Electrification, plumbing, climate control, and fire safety have reached near-universal penetration. The share of renters in substandard housing has fallen from nearly half to under 5%. Homeownership sits at rates that would have been considered remarkable in any decade before 1970.
The forces producing the next chapter of housing quality — printed construction, engineered wood, zoning liberalization — are the same forces that produced the last 75 years of progress: private investment chasing returns, competition driving down costs, and market mechanisms routing resources toward what families actually want and need.
The arc of American housing bends toward better. The evidence is in the numbers. The engine is the market.
Bold Arc Index | Component 5: Housing & Shelter | Weight: 12%
📚 Recommended Reading

A recommended book that goes deeper on this topic.
View on Amazon →Bold Arc earns a small commission on purchases at no extra cost to you.